
作者/講者: 王舜禾醫師, 楊文萍醫師, 徐永勳醫師

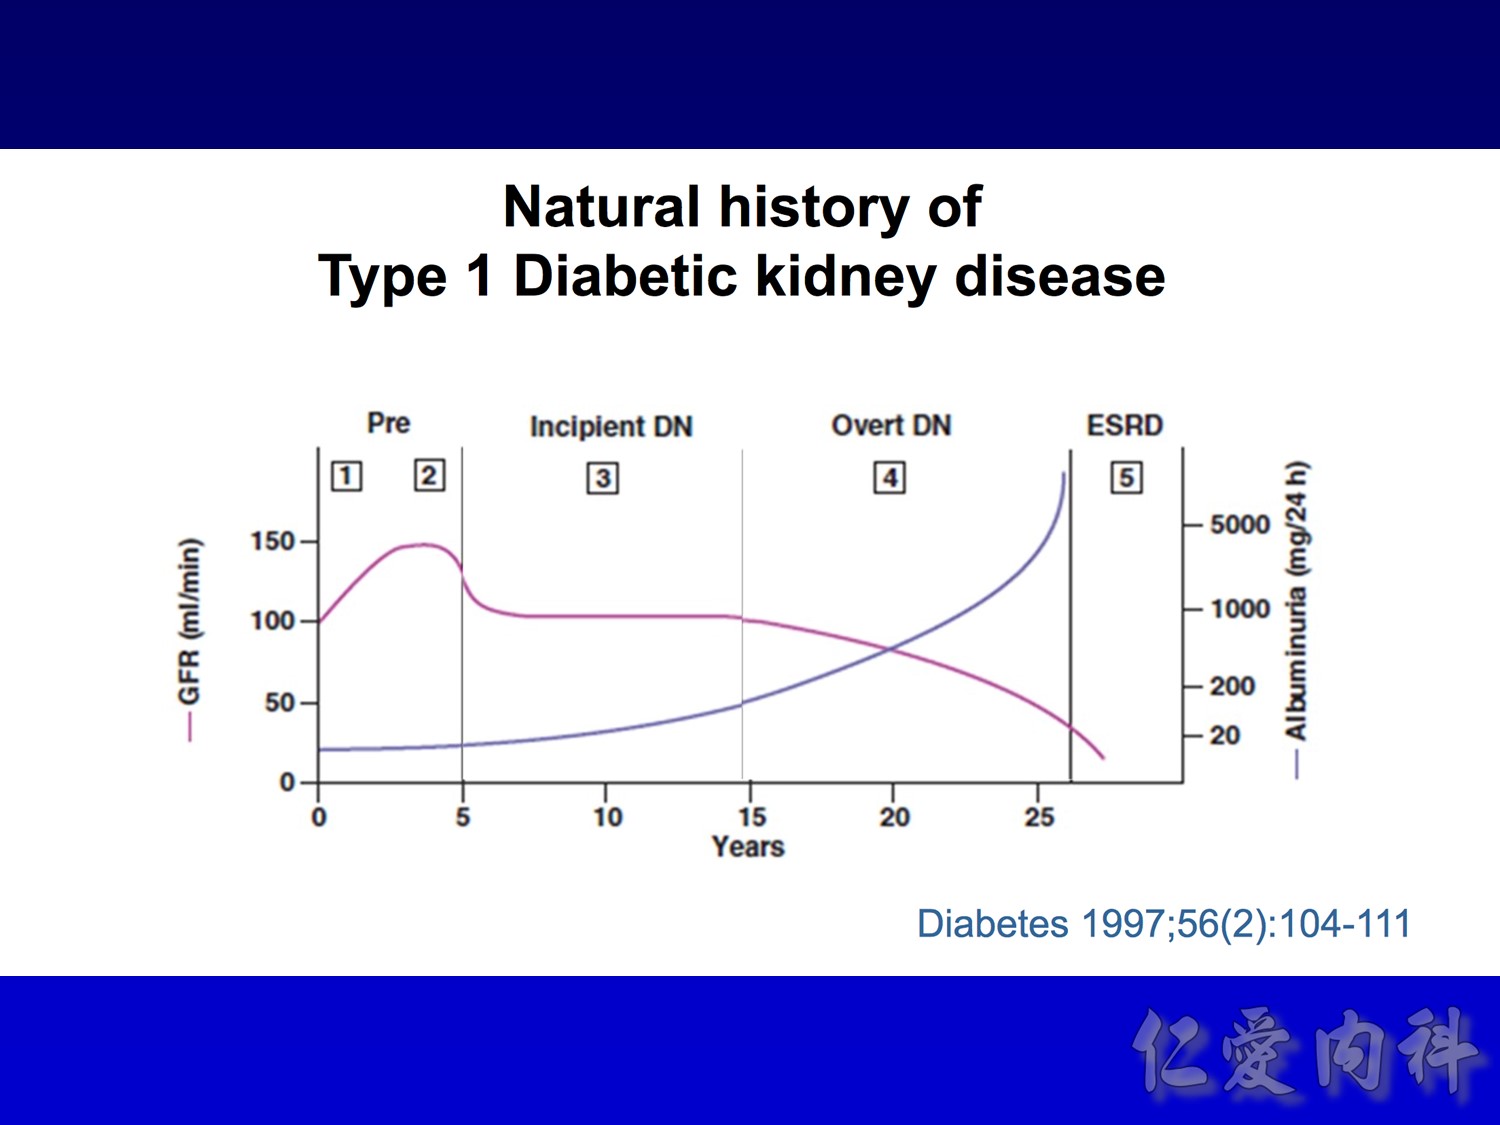
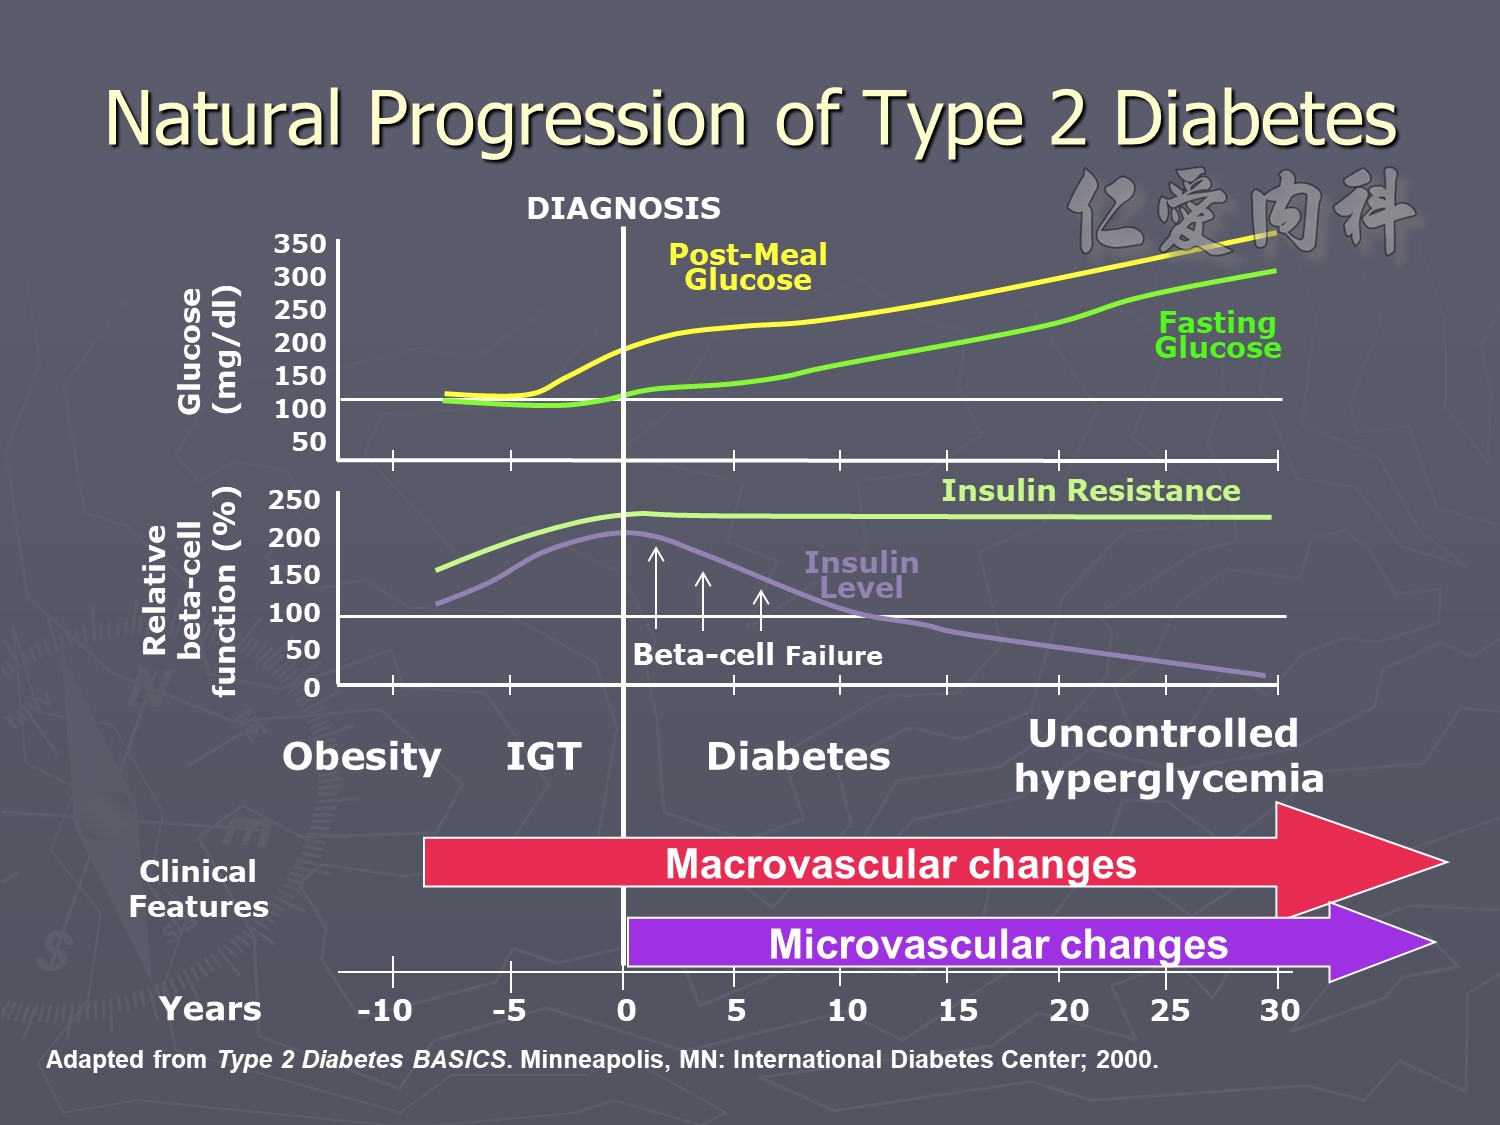
Four stages :
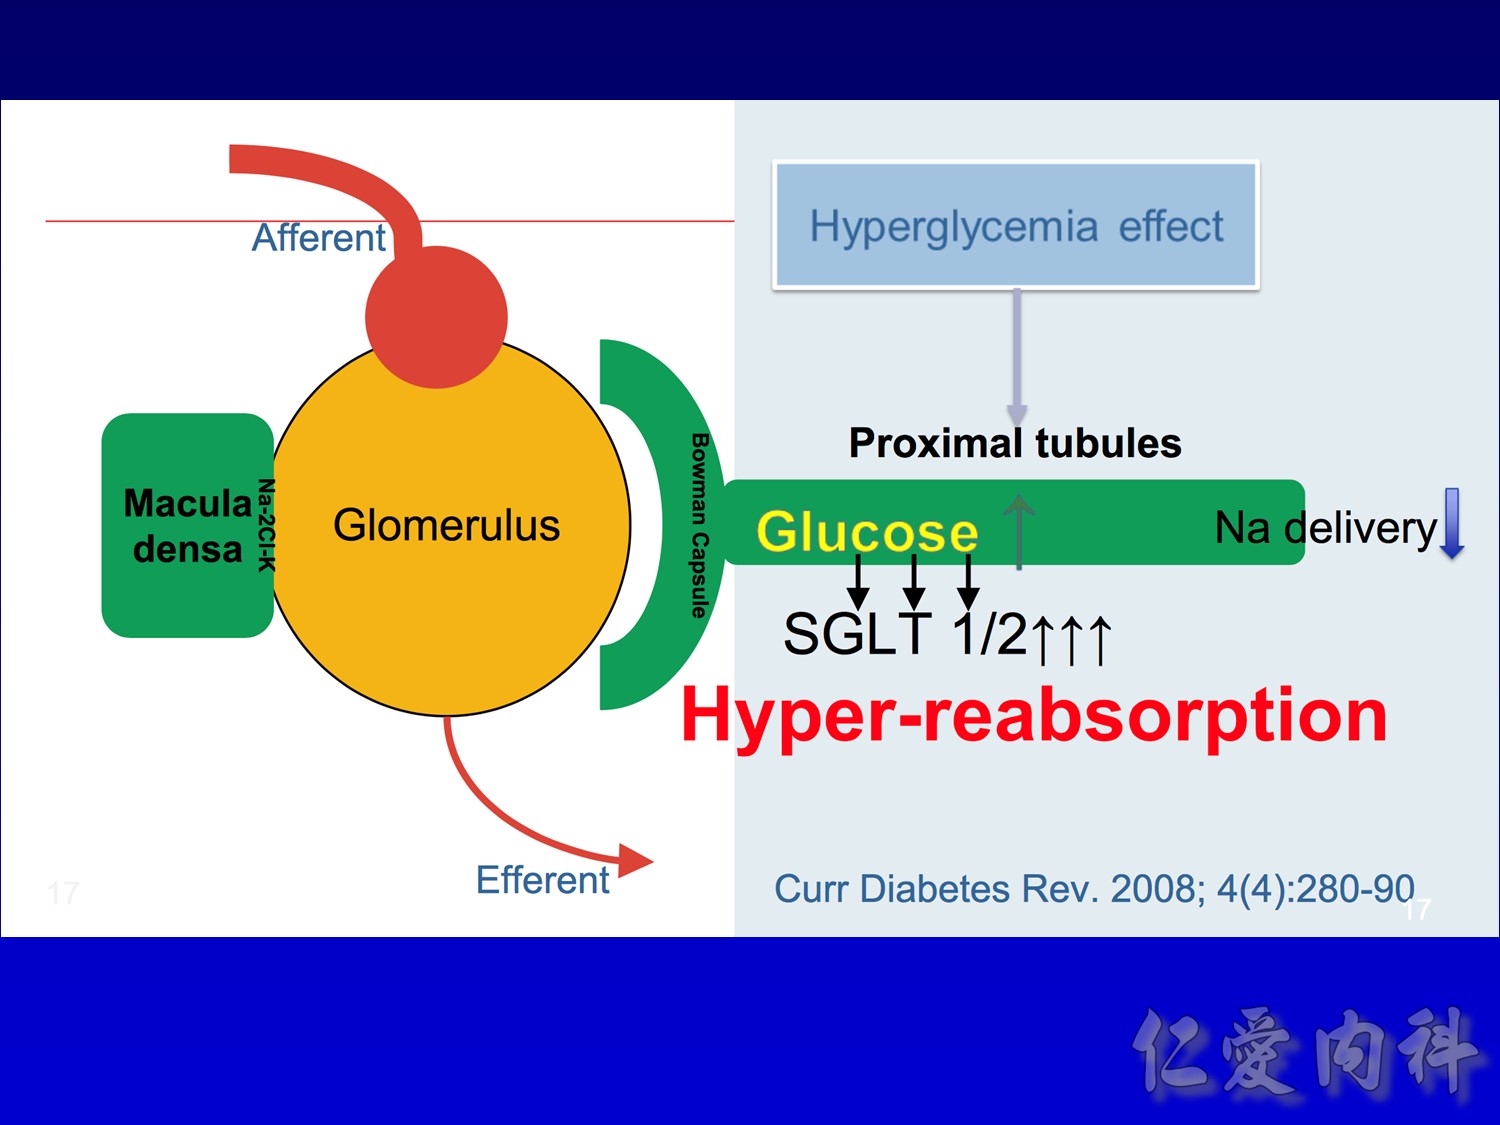
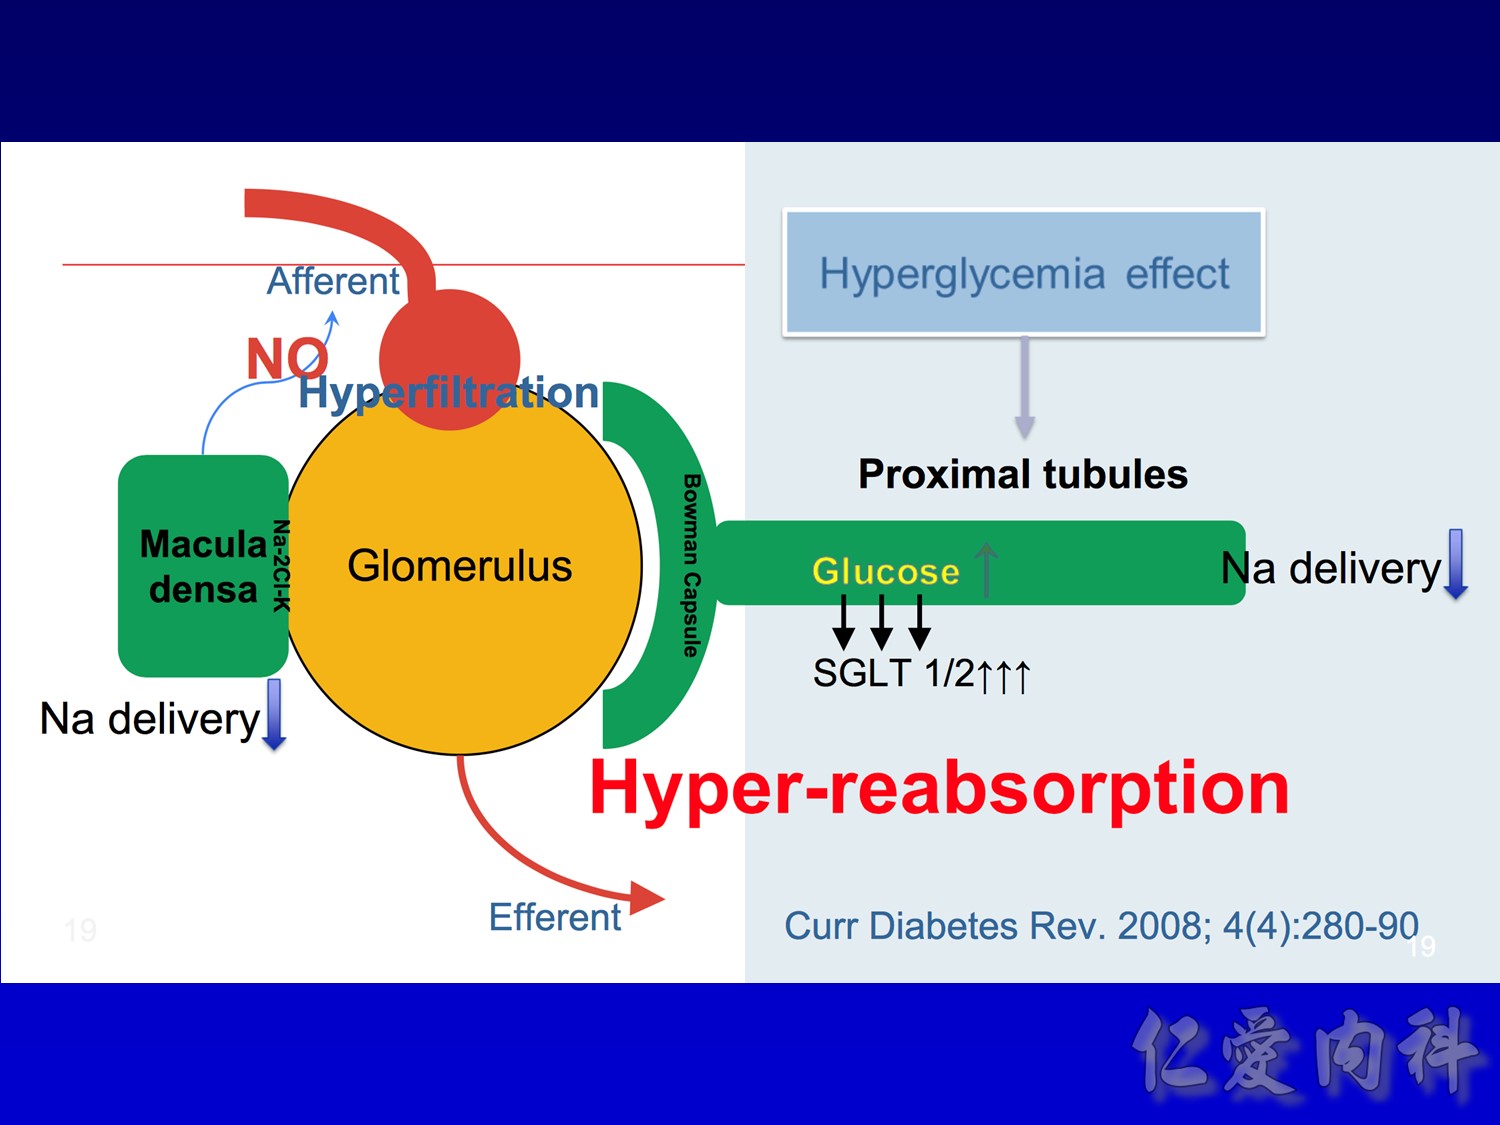
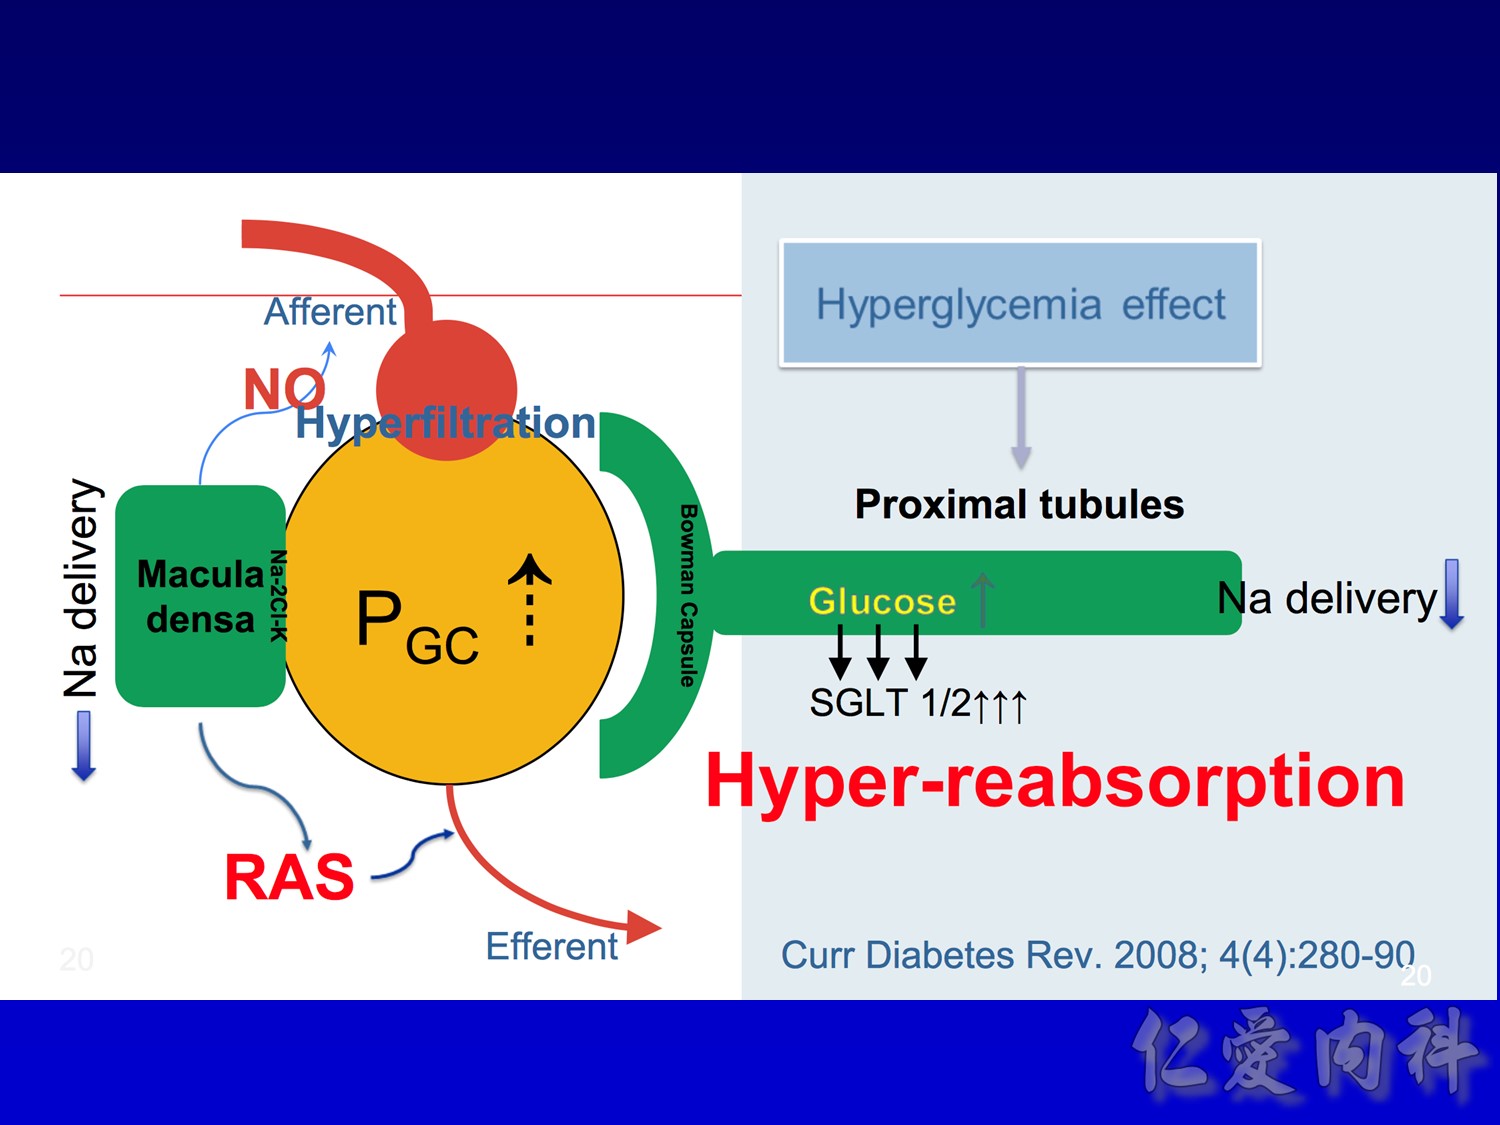
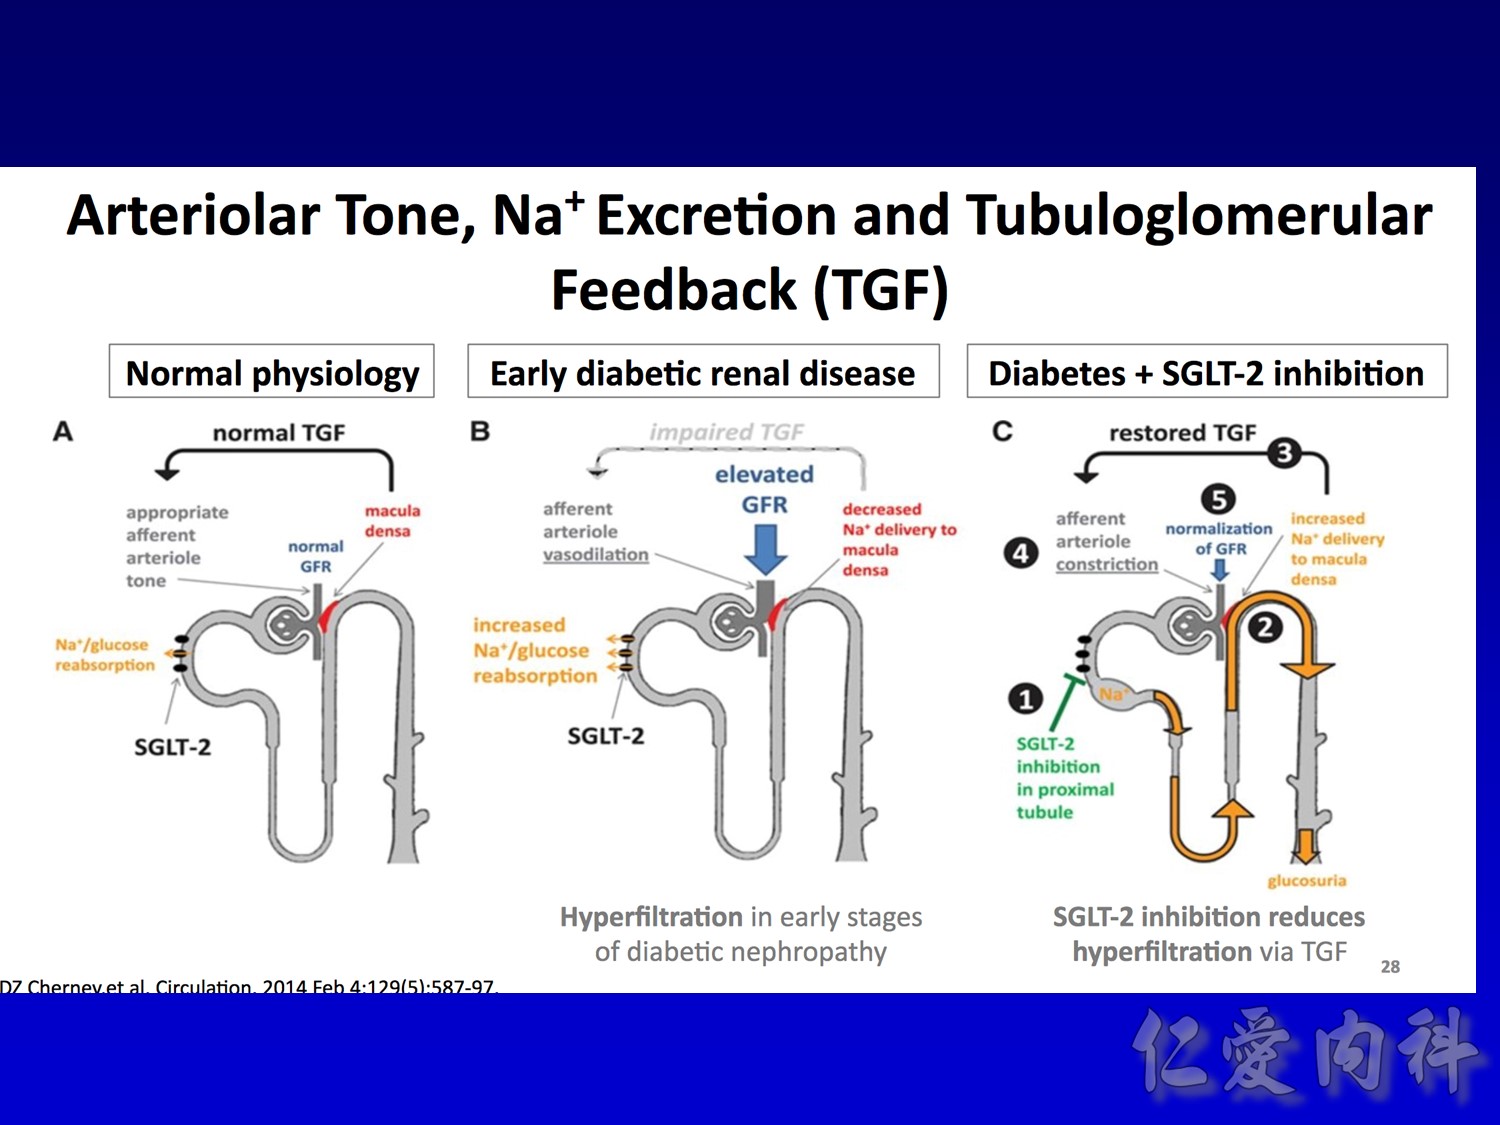
Hyperfiltation
Microalbuminemia IRMA, aprovel (150) VS (300)
Macroalbuminemia IDNT, aprovel (superior) VS norvasc
ESRD
A total of 1,441 subjects with type 1 diabetes were enrolled. Of these, 726 subjects were recruited within the first five years after developing diabetes and had no evidence of diabetic retinopathy nor of microalbuminuria at baseline (the primary prevention cohort). Another 715 subjects were recruited within the first fifteen years after developing diabetes and had mild-to-moderate background diabetic retinopathy with either normoalbuminuria or microalbuminuria (the secondary intervention cohort).
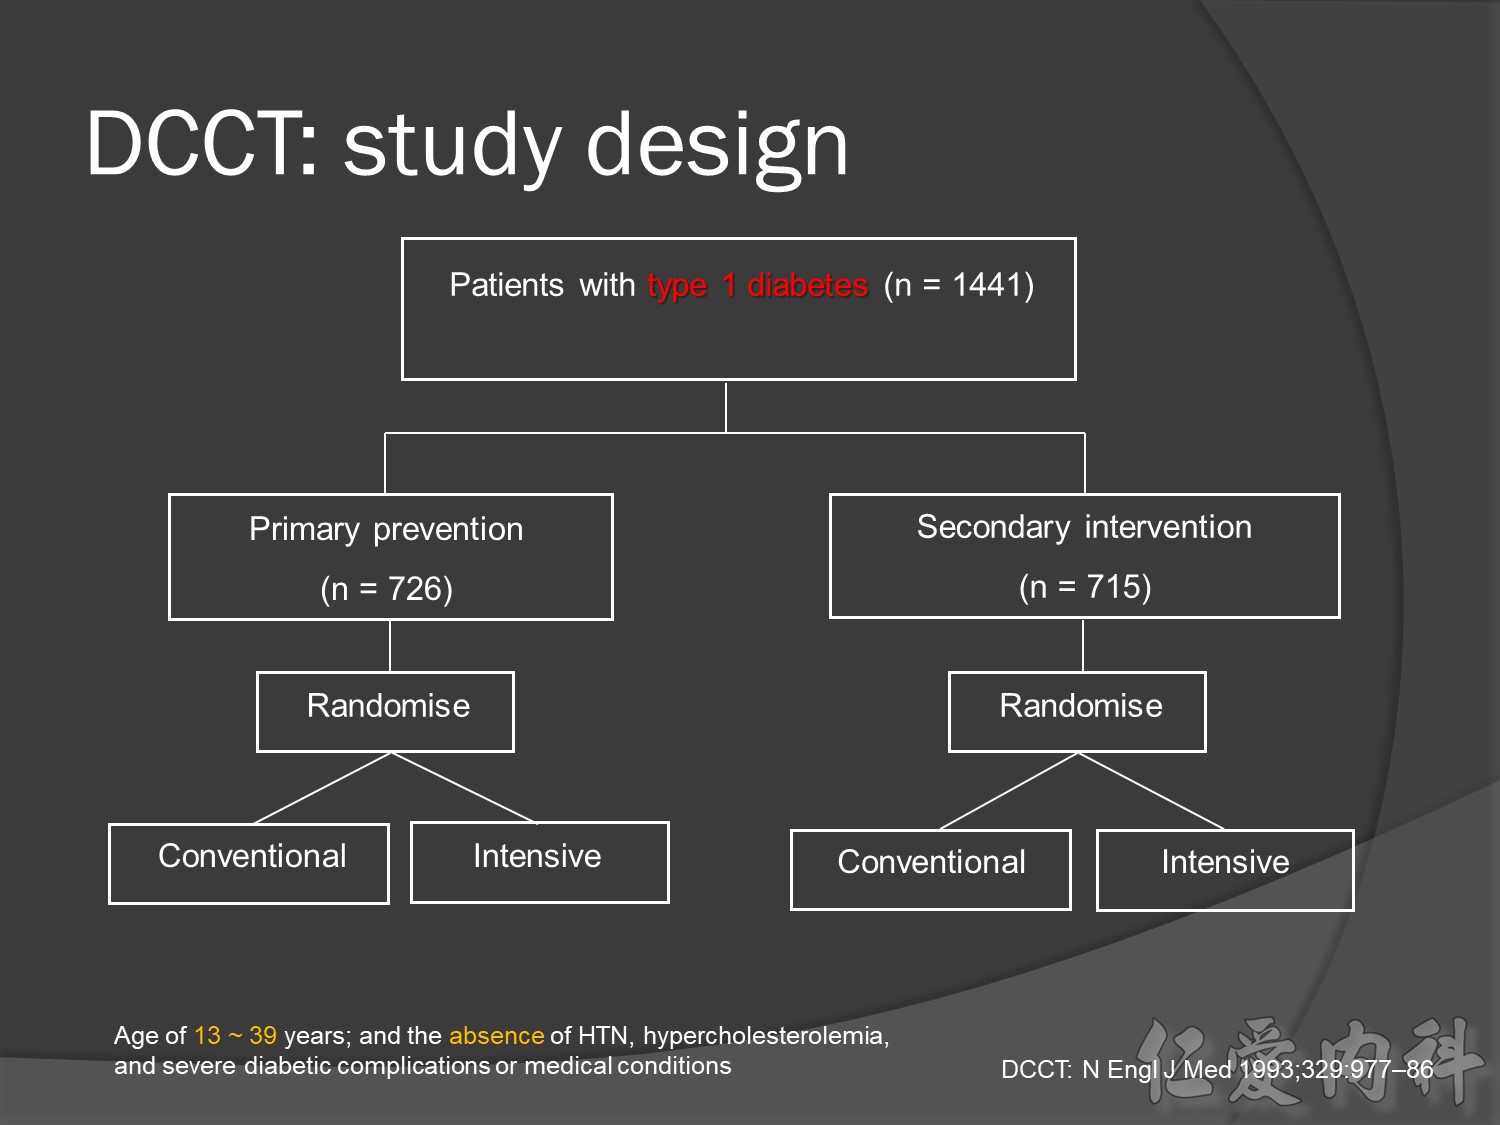
DCCT was the largest study ever conducted to investigate the effect of intensive insulin treatment on the development and progression of complications in type 1 diabetes.
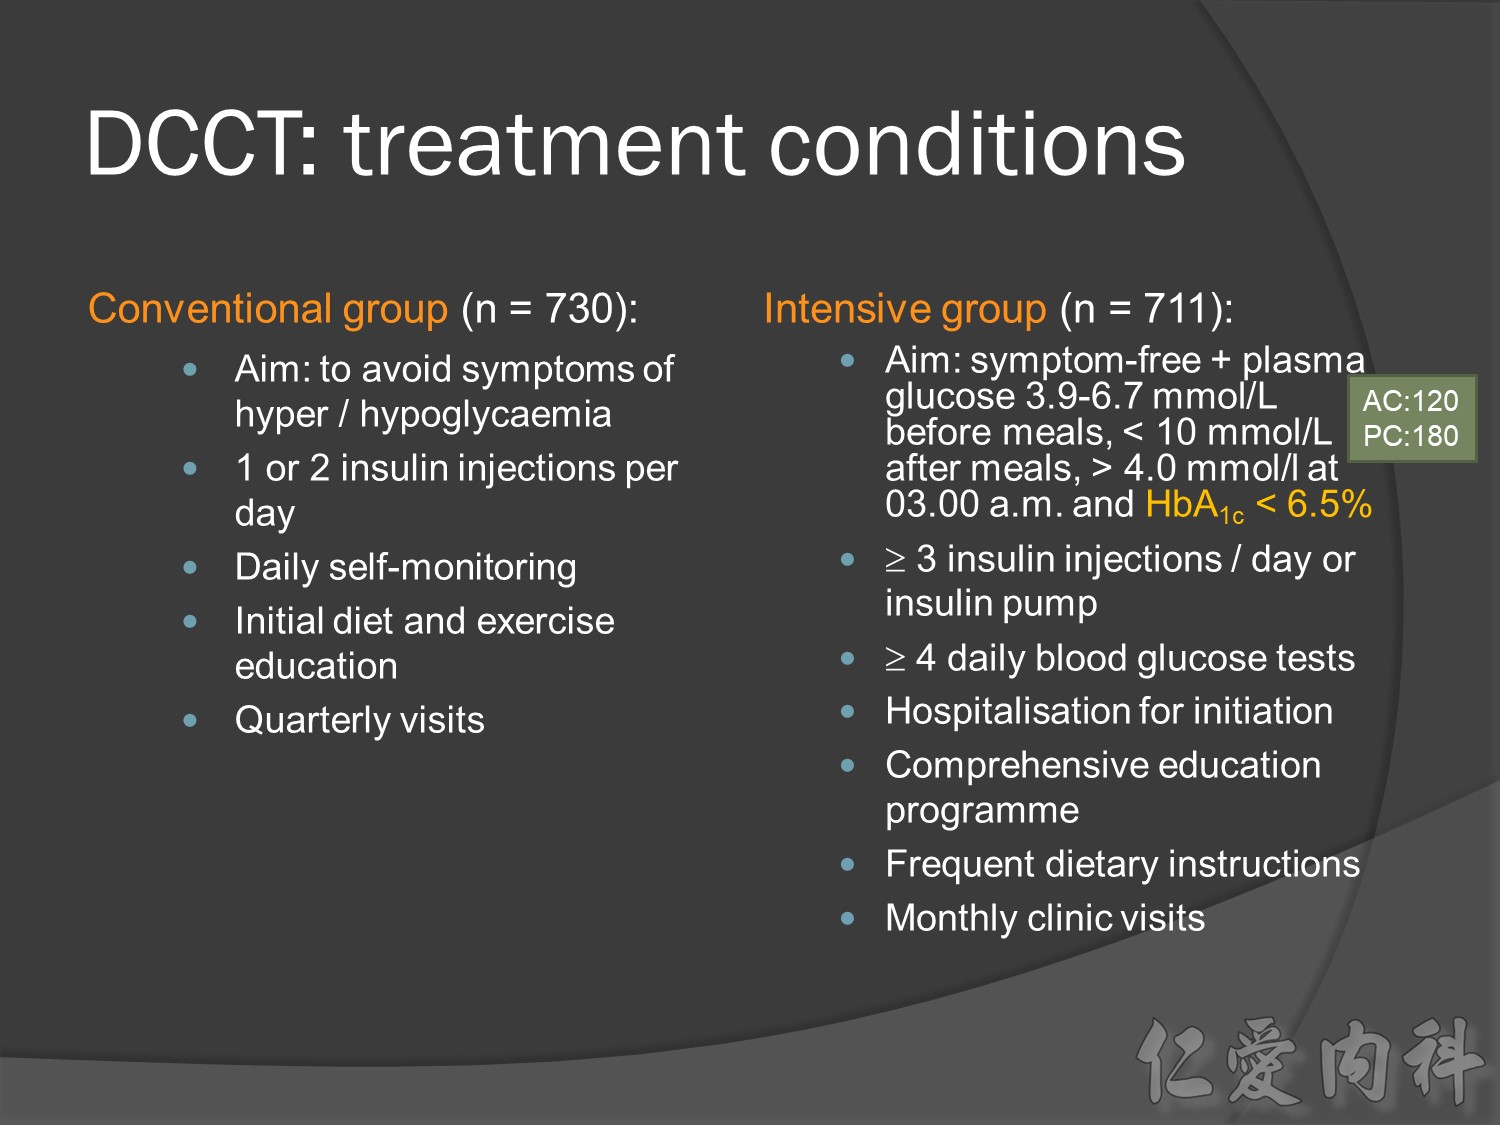
At baseline, all patients had type 1 diabetes with either no retinopathy (primary prevention group) or mild retinopathy (secondary intervention group). During the study, patients received conventional treatment with once or twice daily insulin injections or intensive treatment with an insulin pump or at least three daily insulin injections guided by frequent blood glucose monitoring.
In this young population , it is hard to make difference in treatment related macro-vascular events
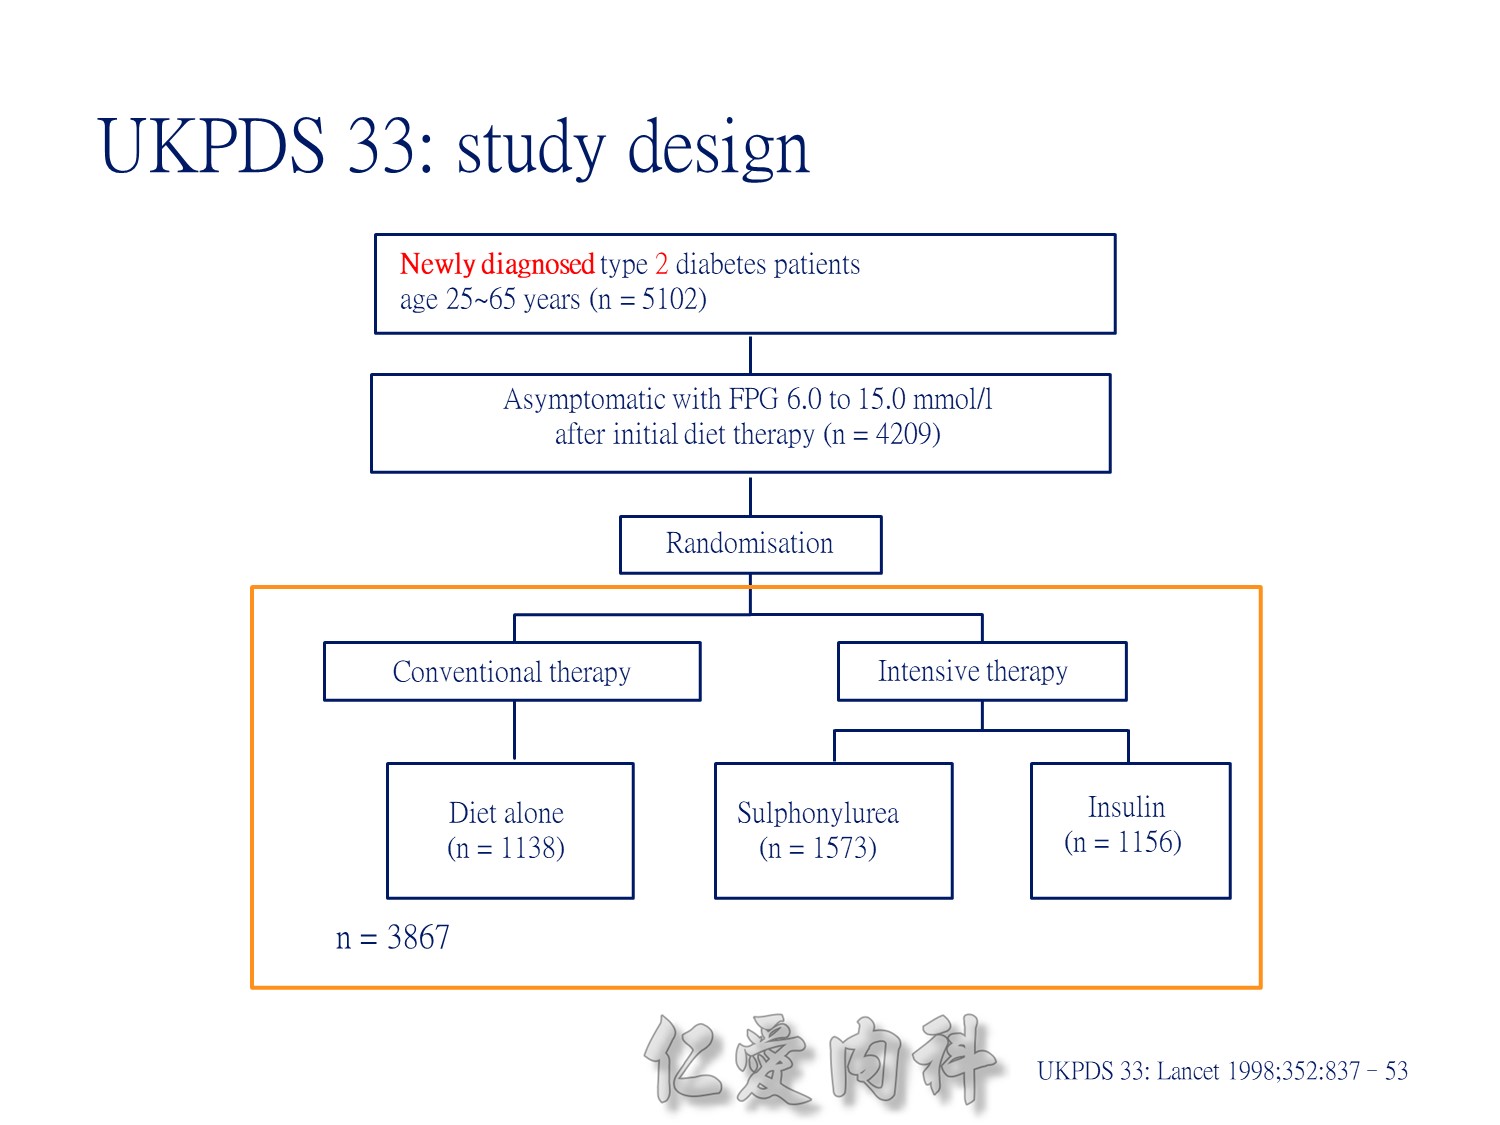
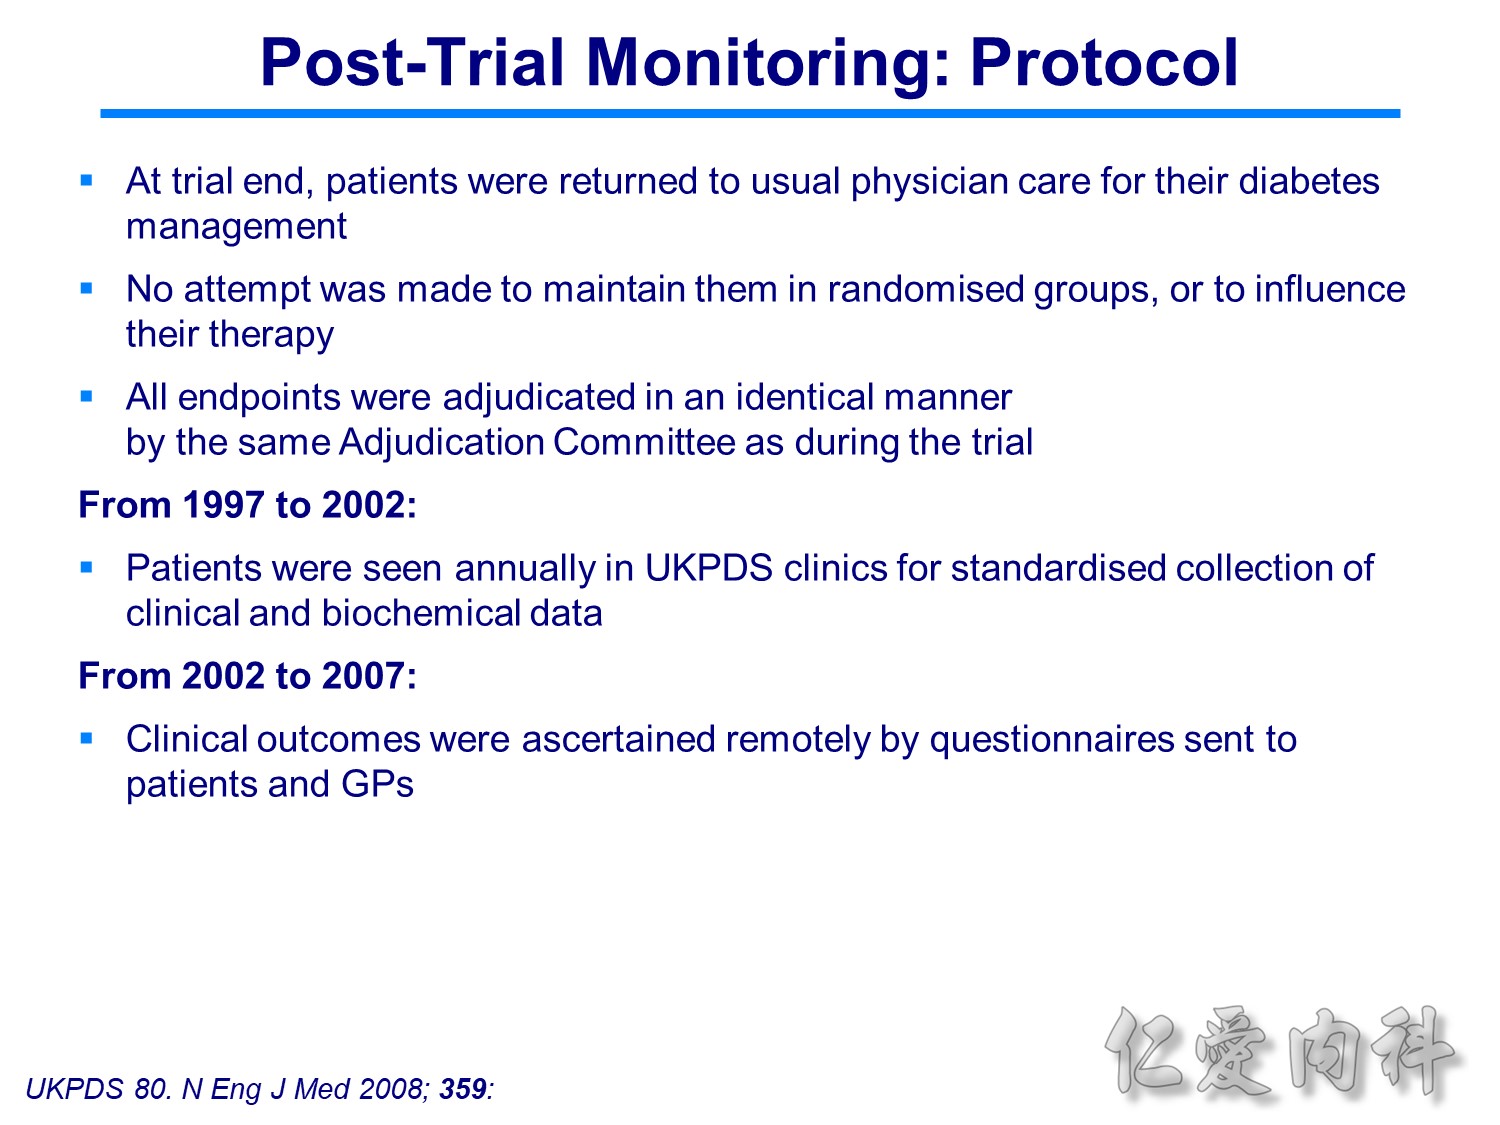
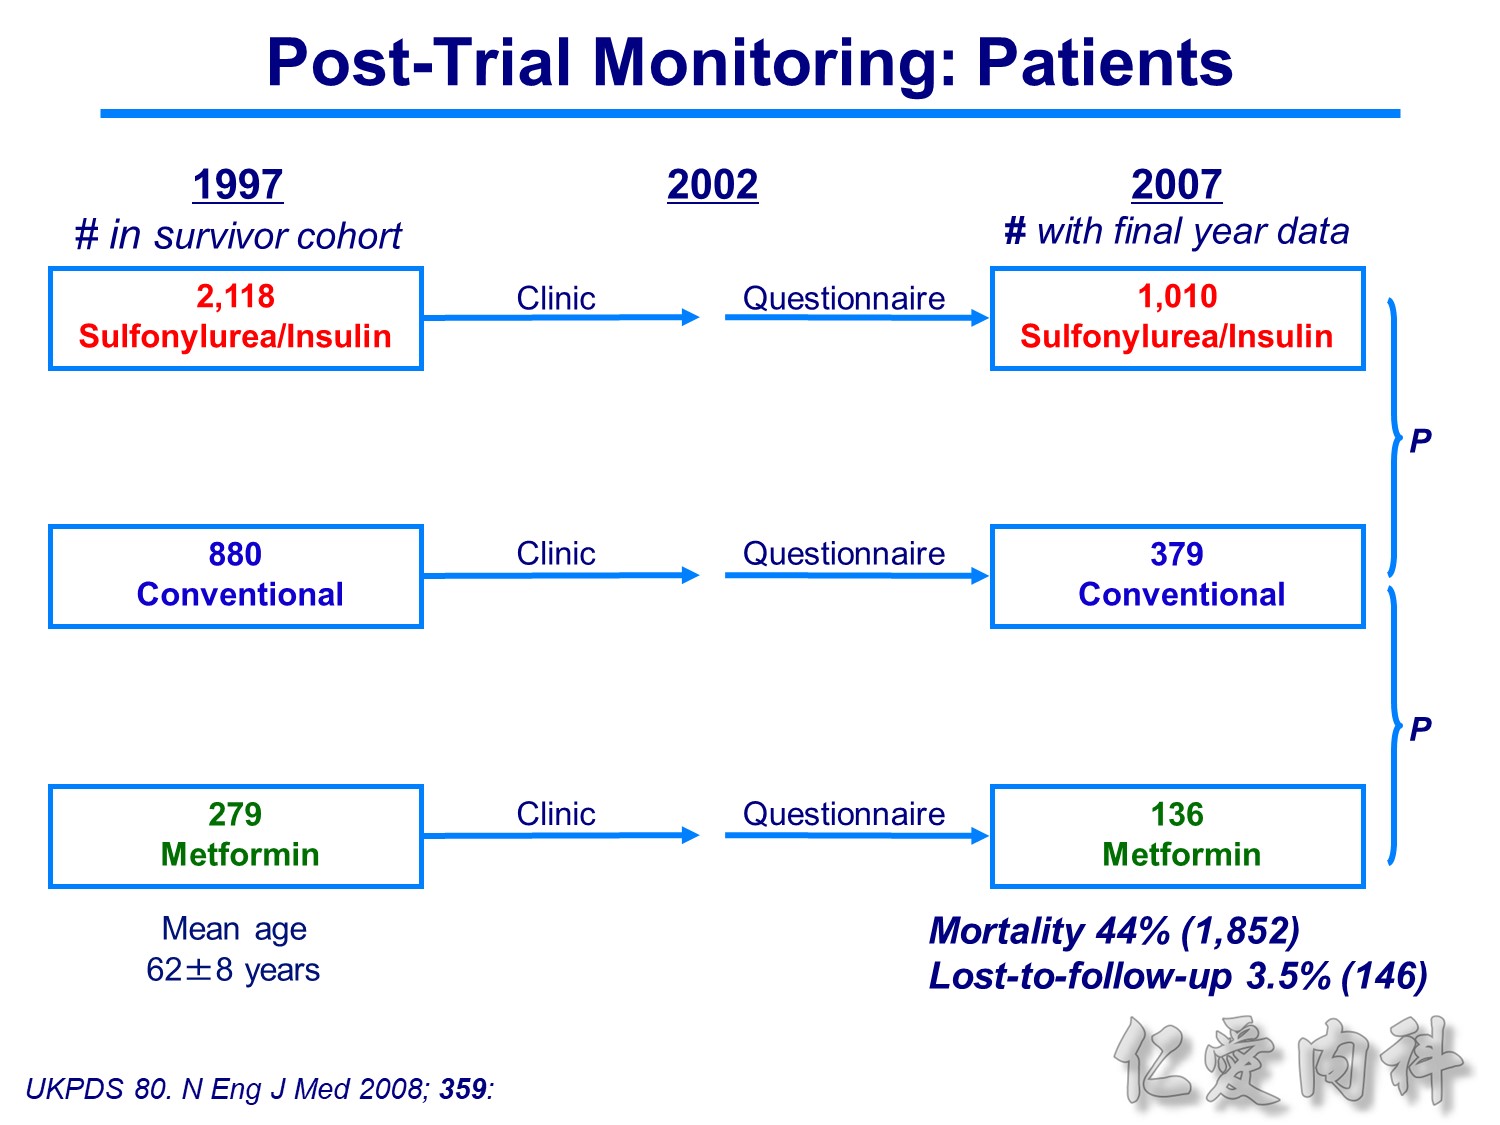
Patients with newly diagnosed type 2 diabetes and within the normal weight range were randomly assigned to conventional treatment with diet alone (30%), intensive treatment with insulin (30%) or intensive treatment with a sulphonylurea (chlorpropamide or glipizide, 40%).
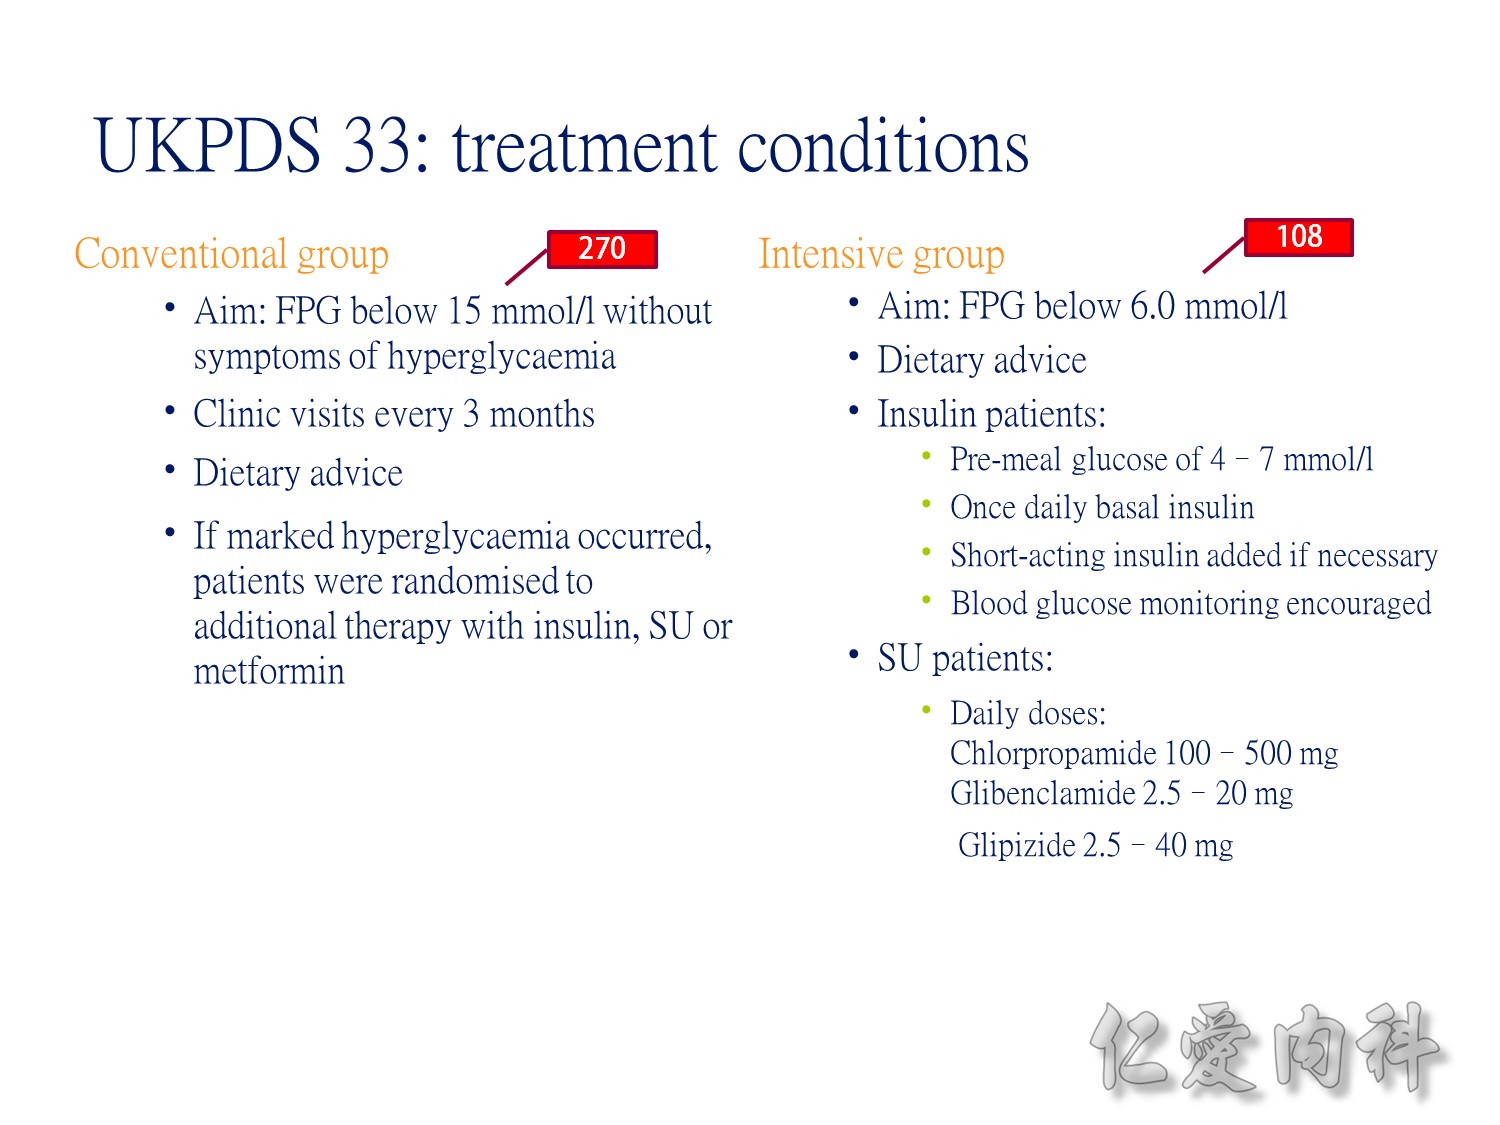
Conventional VS intensive(tight sugar control) therapy
過10 years MI stroke (macrovascular disease outcome)不變
Microvascular disease outcome , more superior in tight Hba1c control
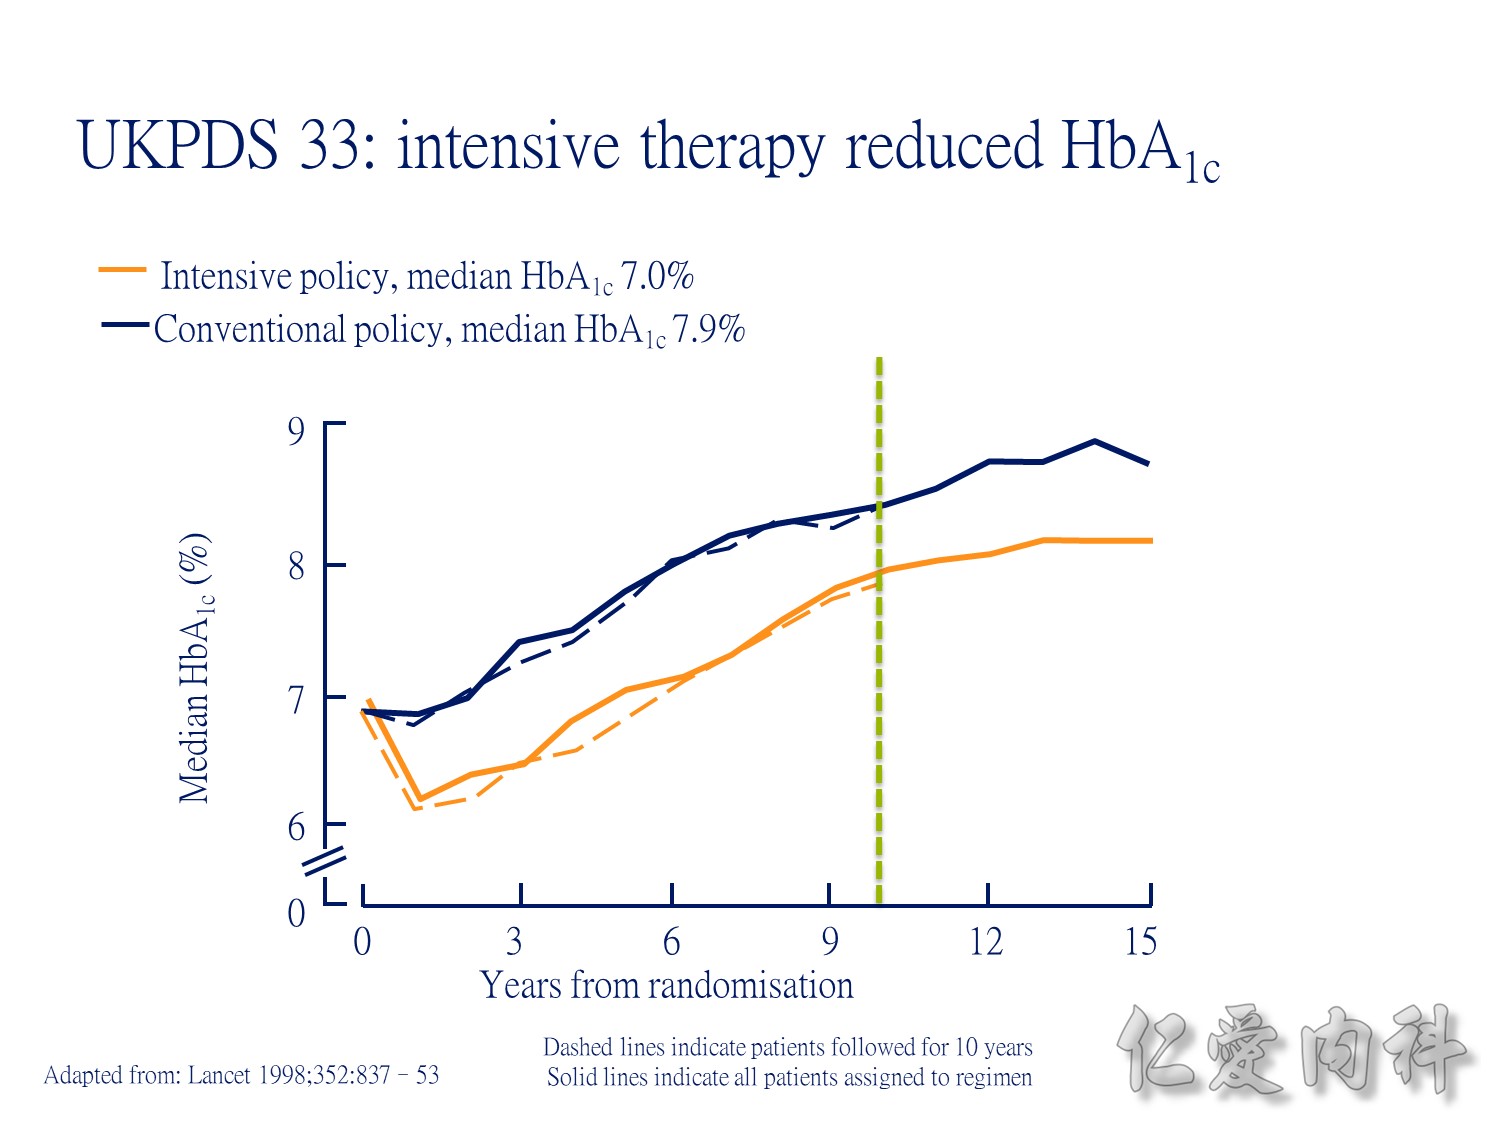
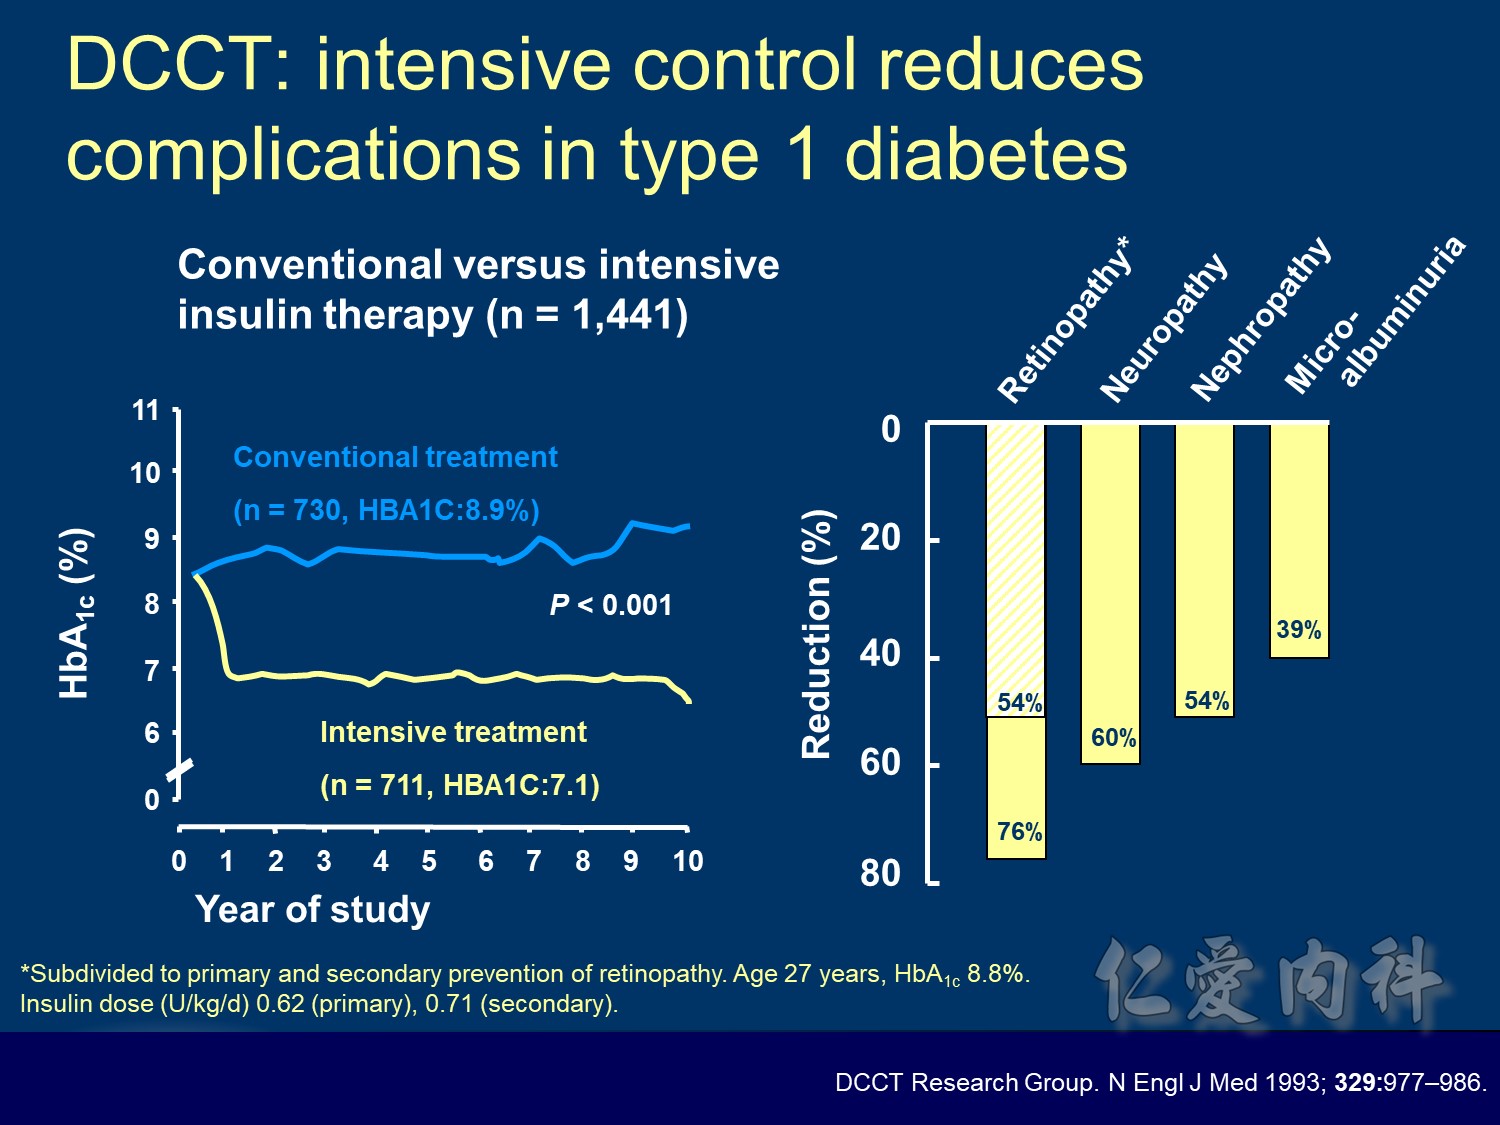
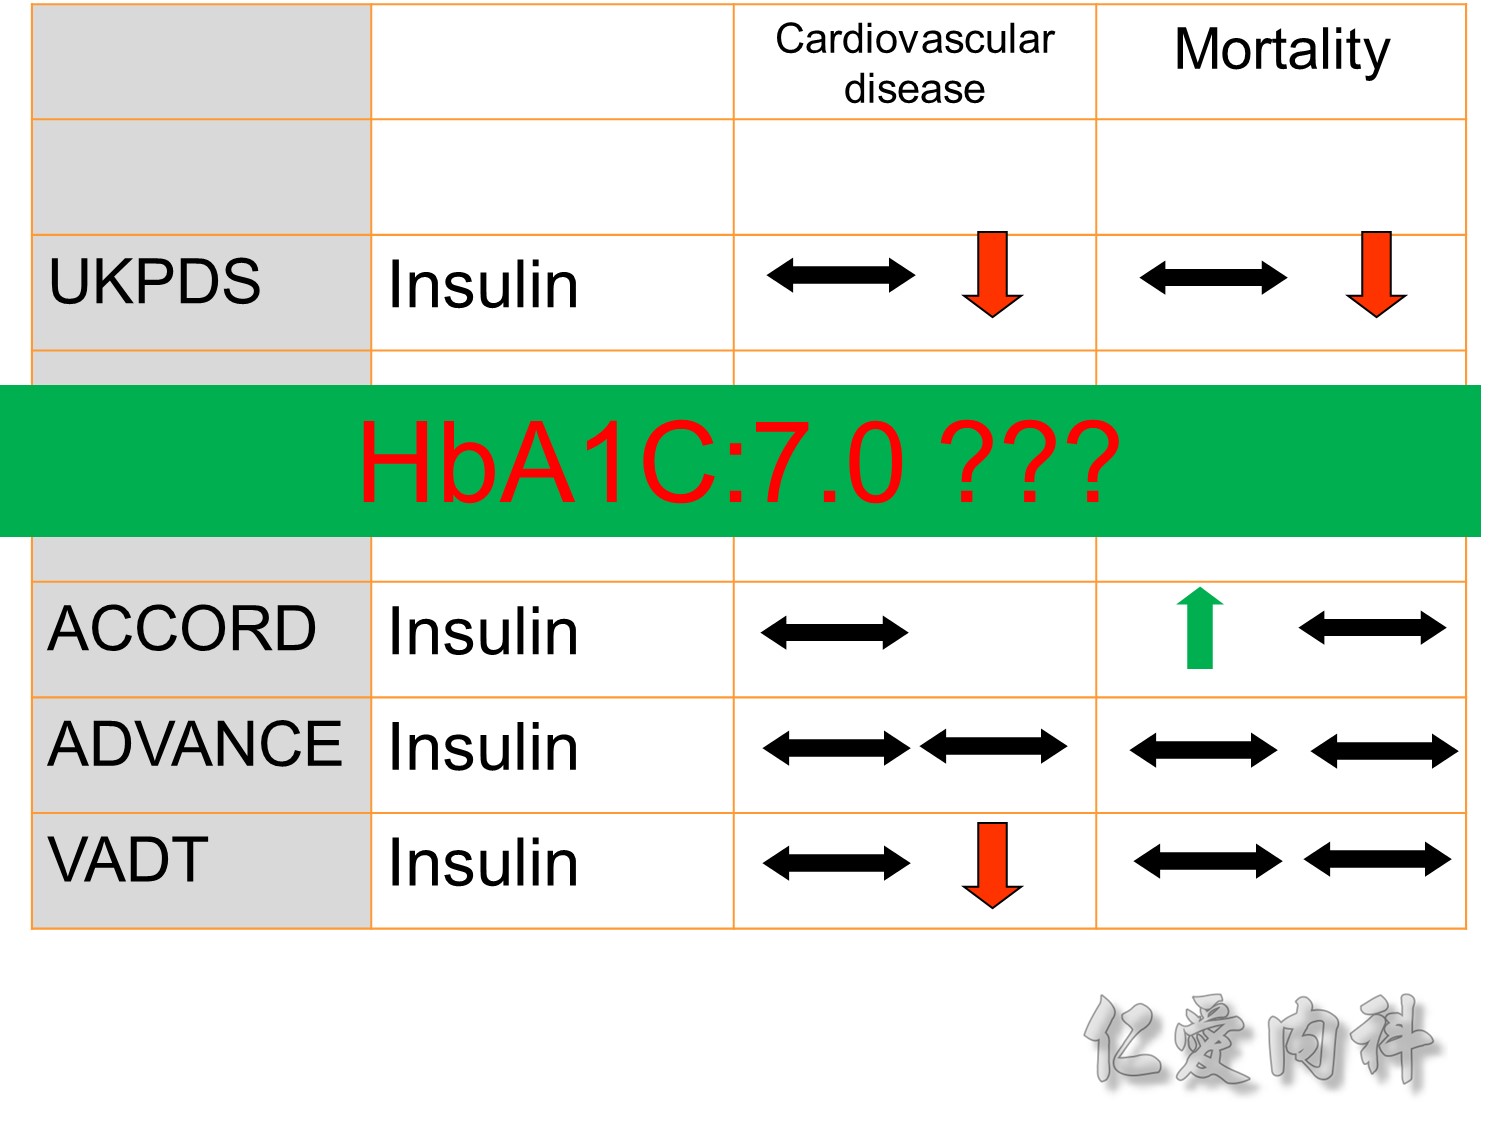
During the first year of therapy, HbA1c decreased with intensive but not conventional treatment. Over the remaining treatment period, HbA1c gradually increased in both groups, although it was maintained at a consistently lower level in patients treated intensively. The median HbA1c was 7.0 and 7.9% following intensive and conventional treatment respectively.
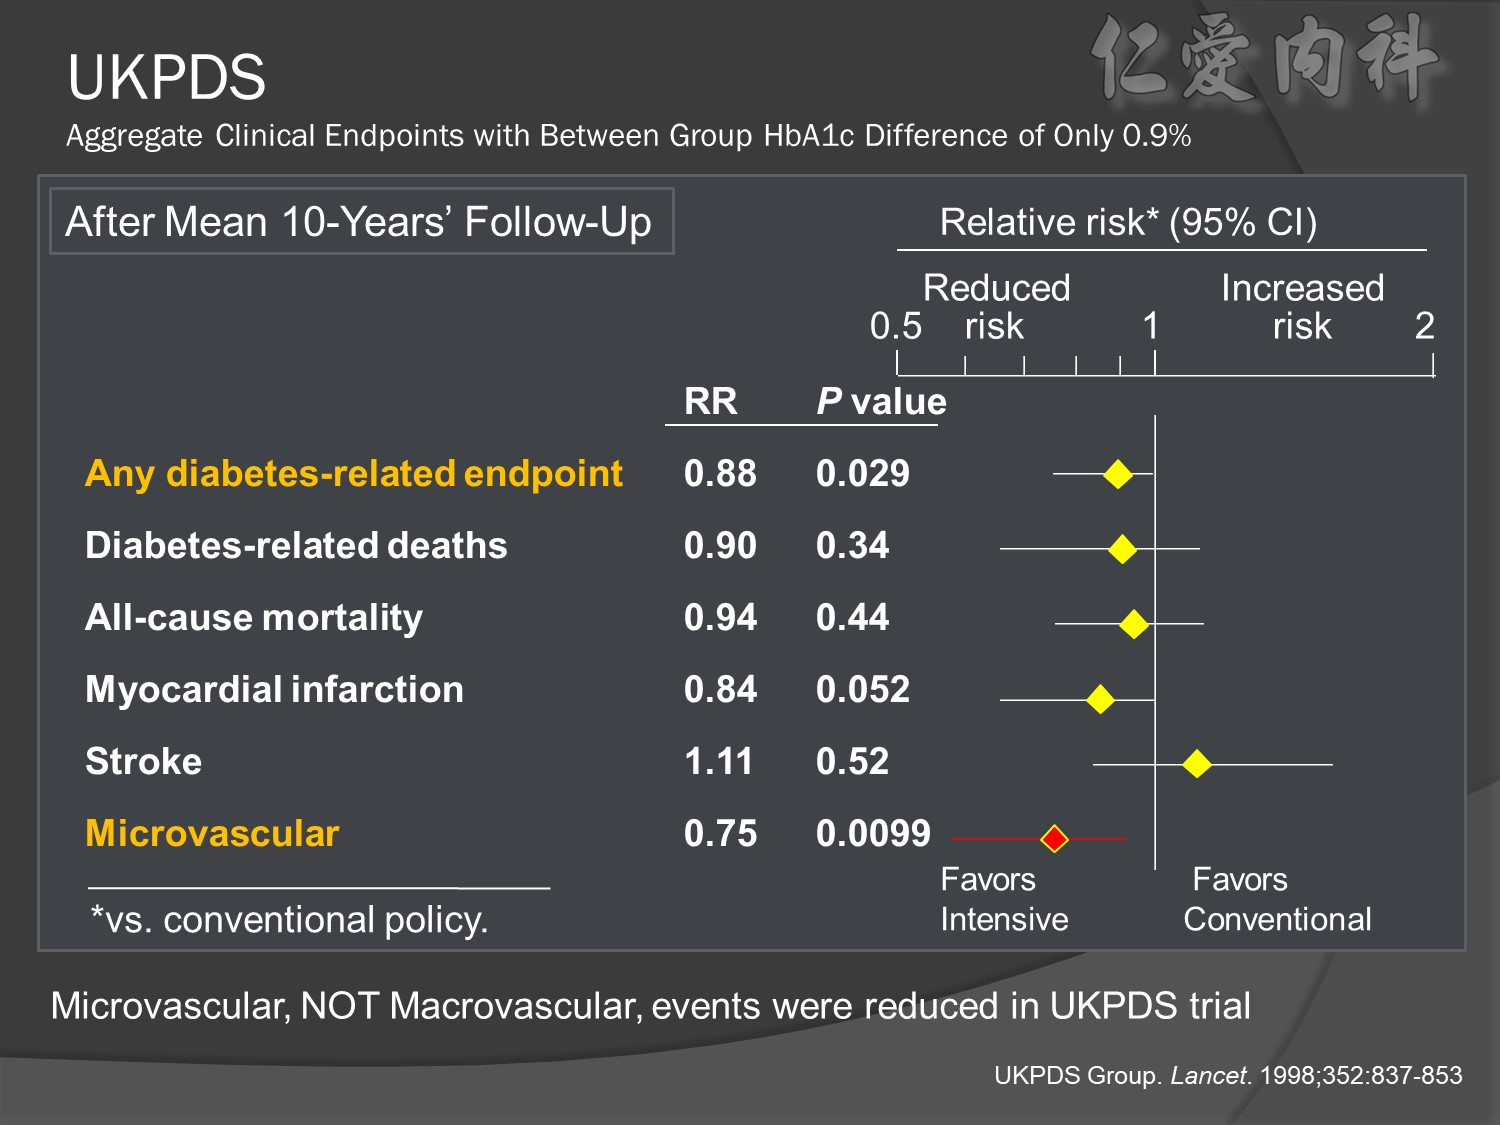
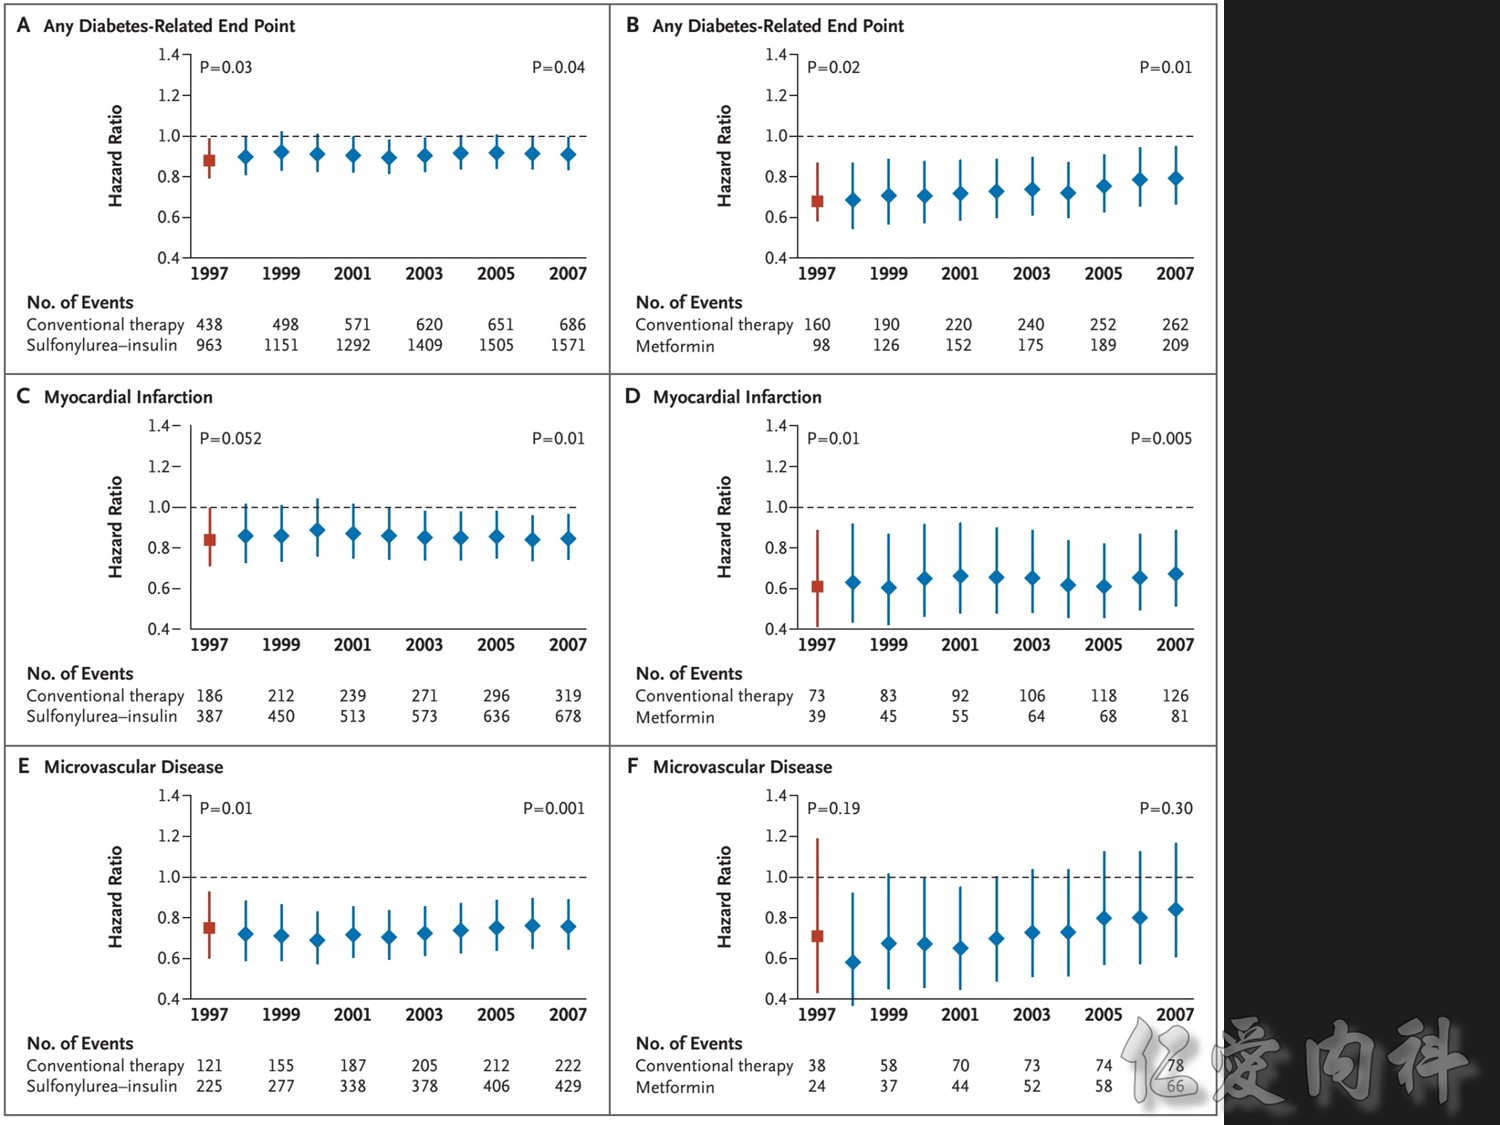
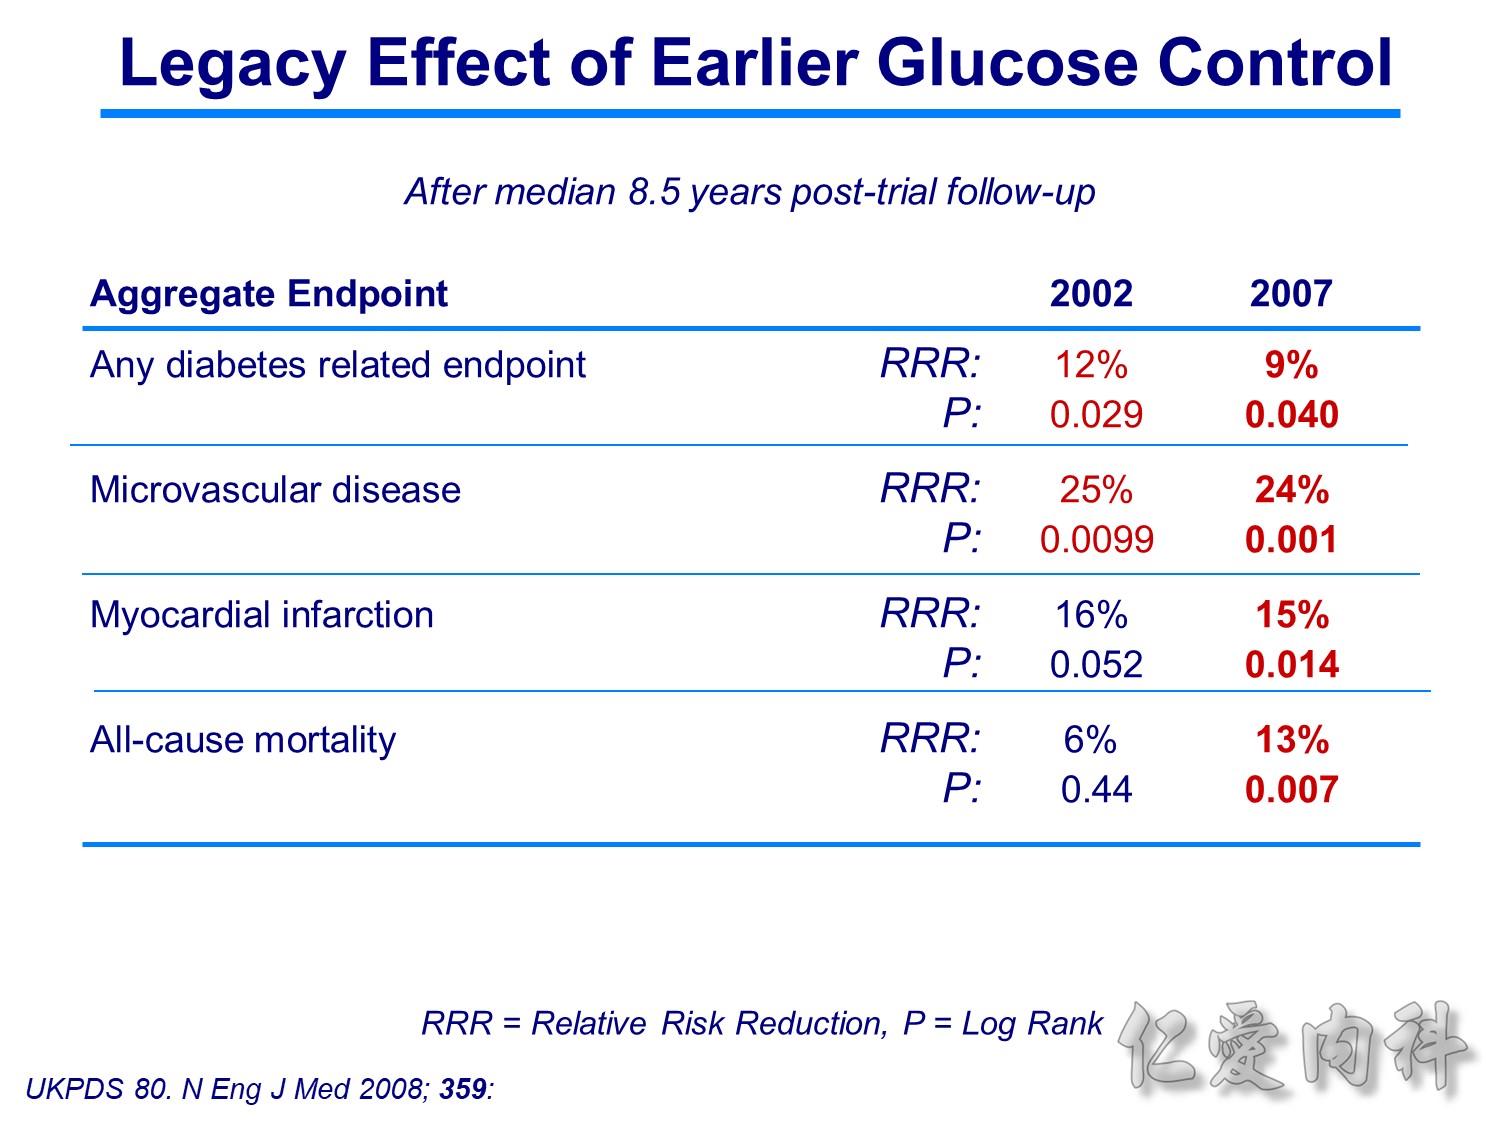
Patients receiving intensive treatment after 11 years of follow-up had a significantly reduced risk of experiencing any diabetes-related endpoint (P=0.029). Intensive treatment also conferred a significant 25% risk reduction in microvascular endpoints compared with conventional treatment (P=0.0099).1 ( this is the result of Sulfonylurea-insulin group, but less significant in Metformin group)
For myocardial infarction, the 16% reduction in risk for the intensive-treatment group compared with the conventional-treatment group approached significance (P=0.052). There were no significant differences between conventional and intensive treatment in the relative risks of diabetes-related deaths, all-cause mortality, or stroke.1
UKPDS: Improving HbA1c Control Reduced Diabetes-Related Complications
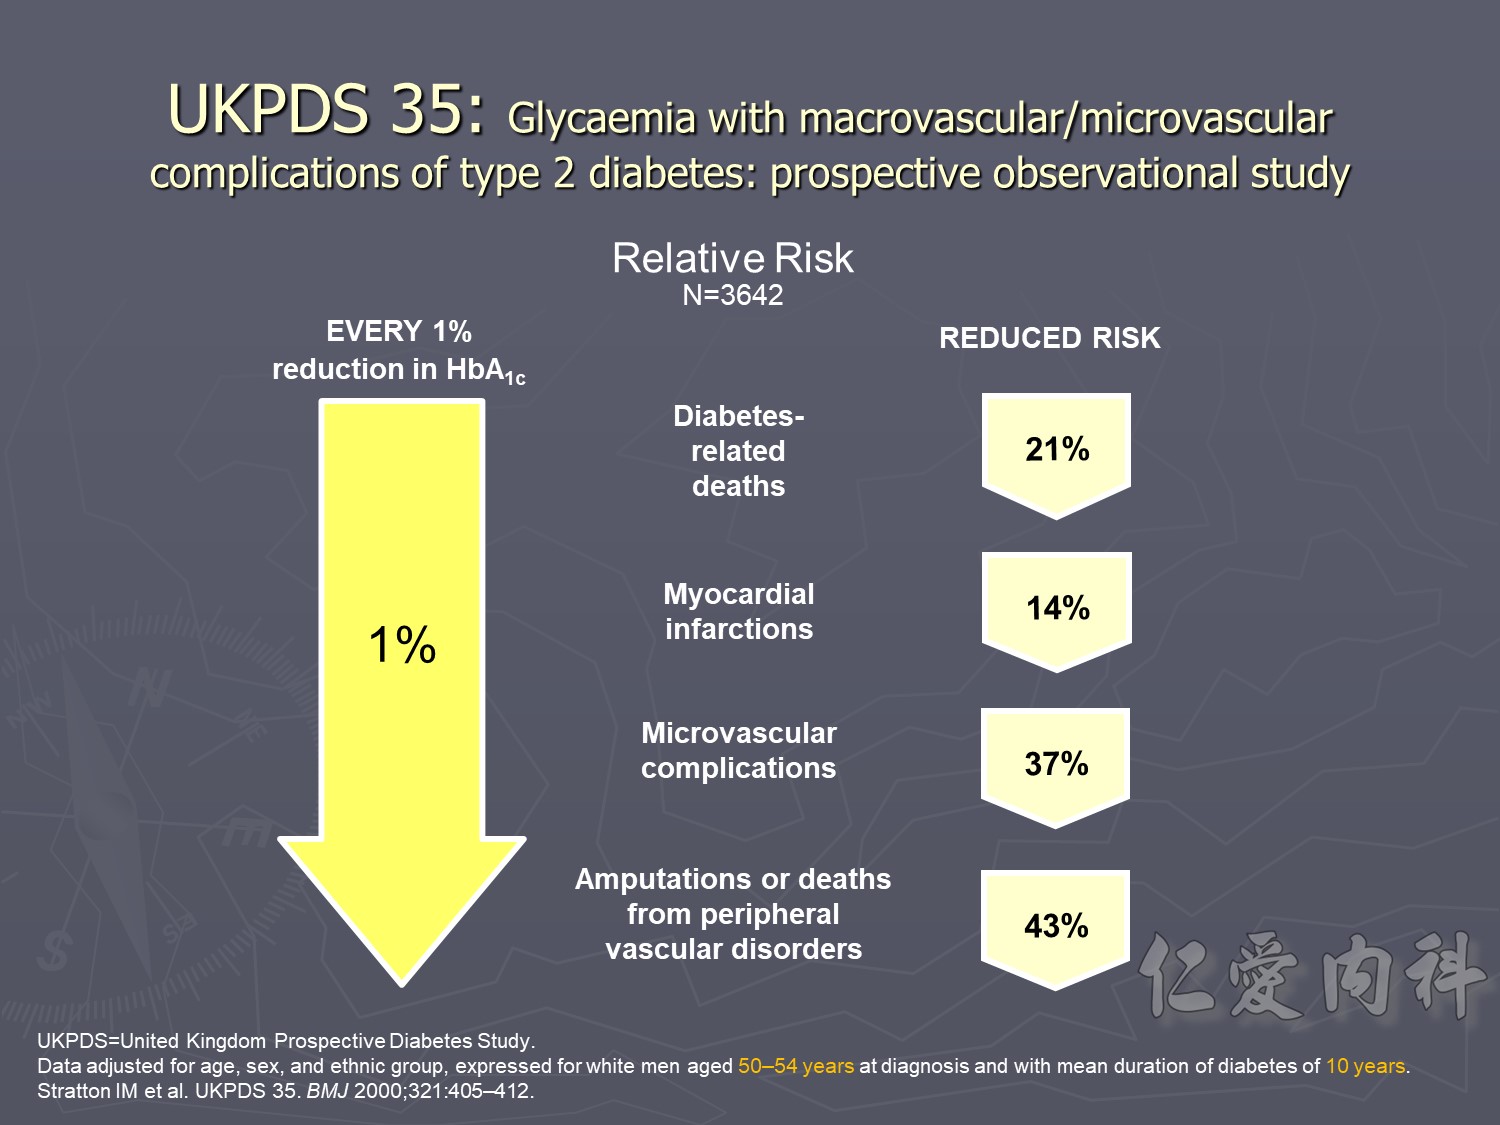
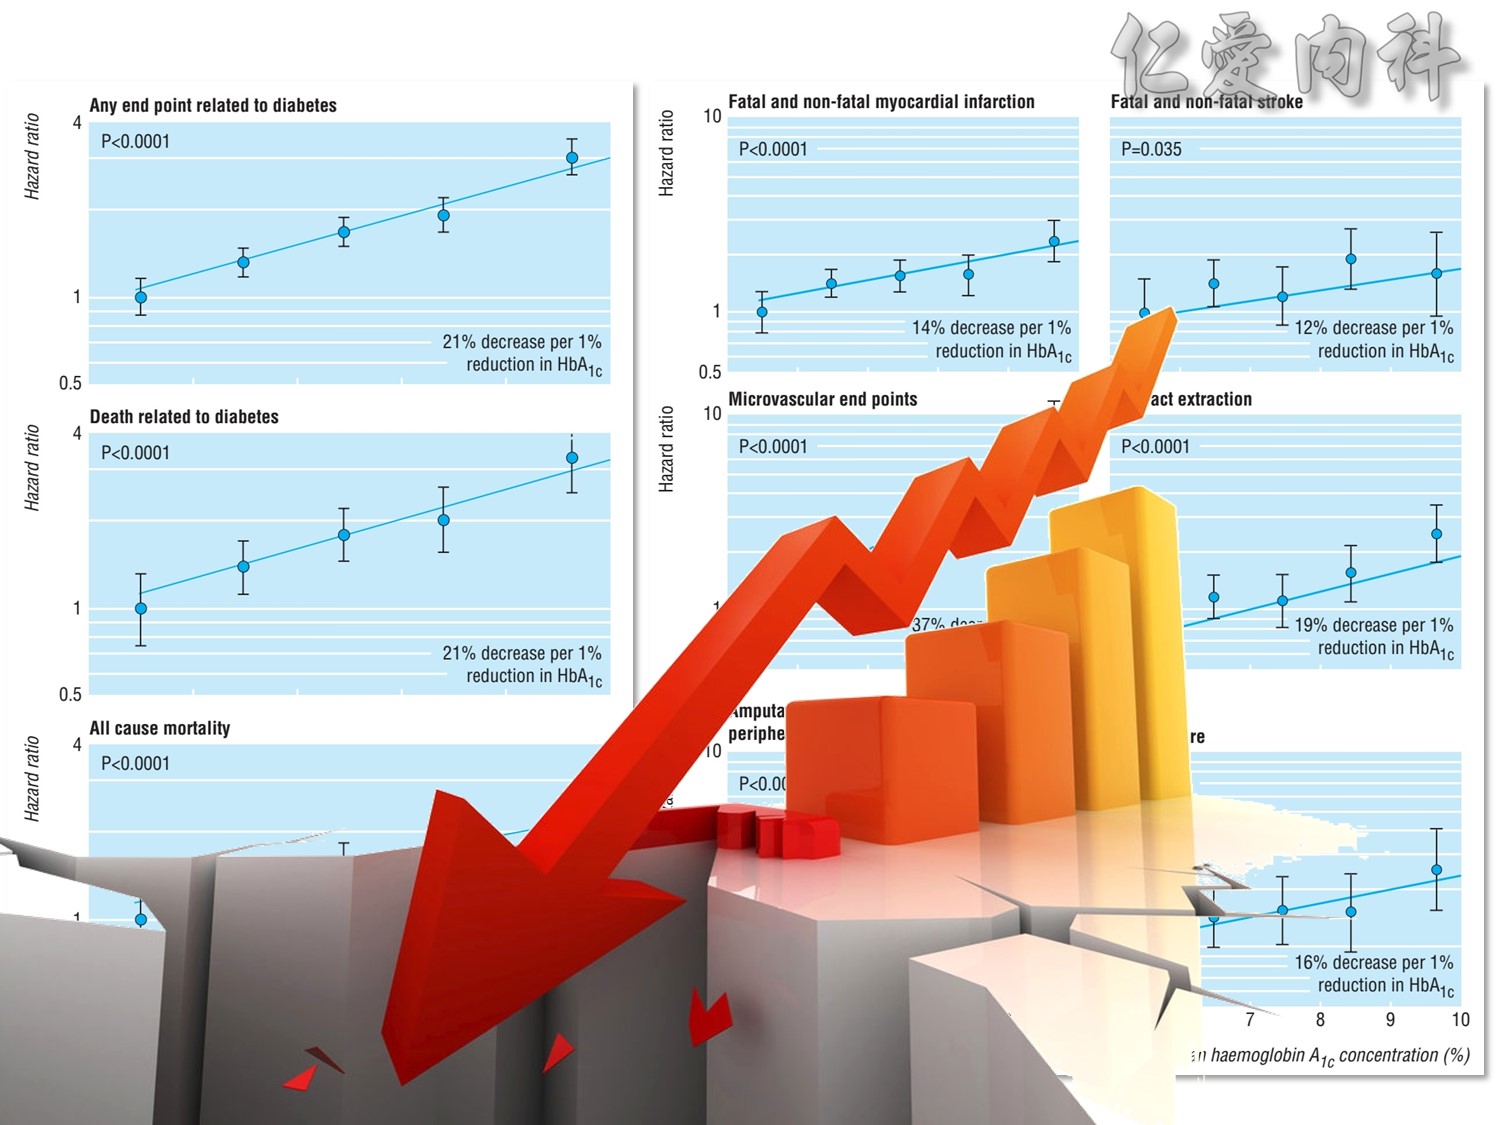
This prospective, observational study evaluated the relationship between exposure to hyperglycaemia over time and the risk of diabetes-related complications among participants in the UKPDS. The analysis of incidence rates included 4585 patients, whereas the analysis of relative risk included 3642 patients.1
This study showed that the risk of microvascular and macrovascular complications in type 2 diabetes is strongly associated with the degree of hyperglycaemia.1
In the observational analysis of the UKPDS cohort, every 1% decrease in HbA1c was associated with clinically important reductions in the risk of1:
Diabetes-related death (mean risk reduction 21%, P<0.0001)
Myocardial infarction (mean risk reduction 14%, P<0.0001)
Microvascular complications (mean risk reduction 37%, P<0.0001)
Peripheral vascular disorders (mean risk reduction 43%, P<0.0001)
Data adjusted for age at diagnosis of diabetes, sex, ethnic group, smoking, presence of albuminuria, systolic blood pressure, high- and low-density lipoprotein cholesterol, and triglycerides.
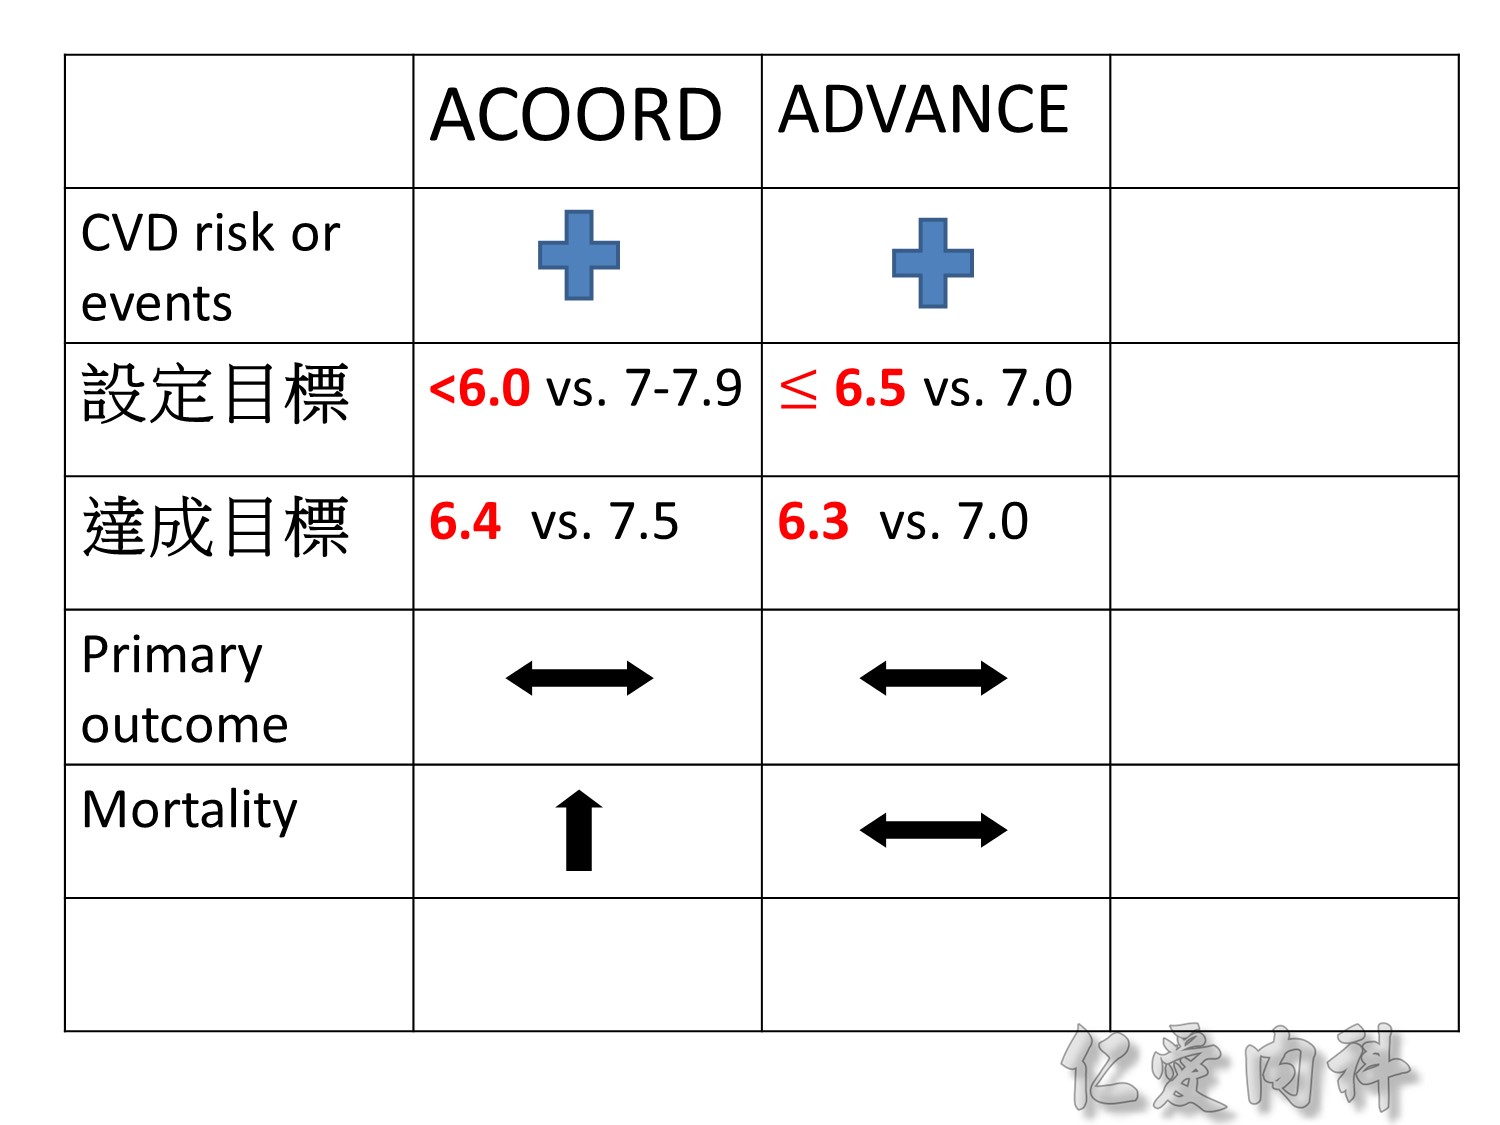
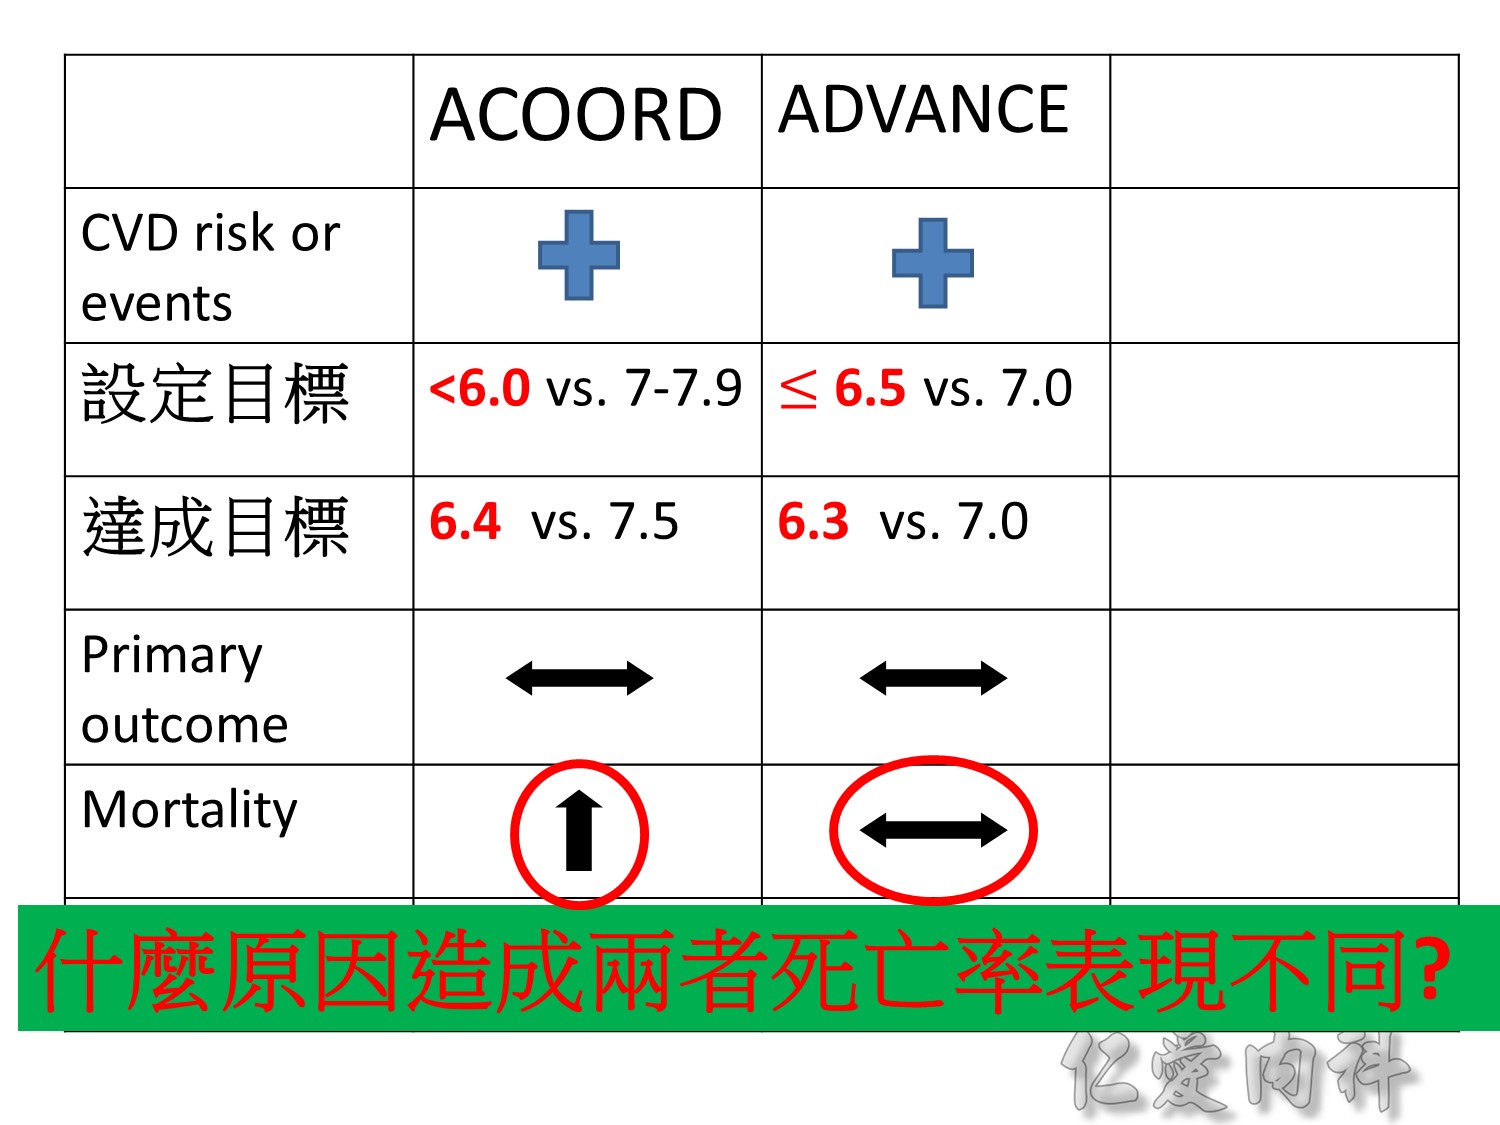
Old patient group, type 2 DM , >55 yrs compared CV risk
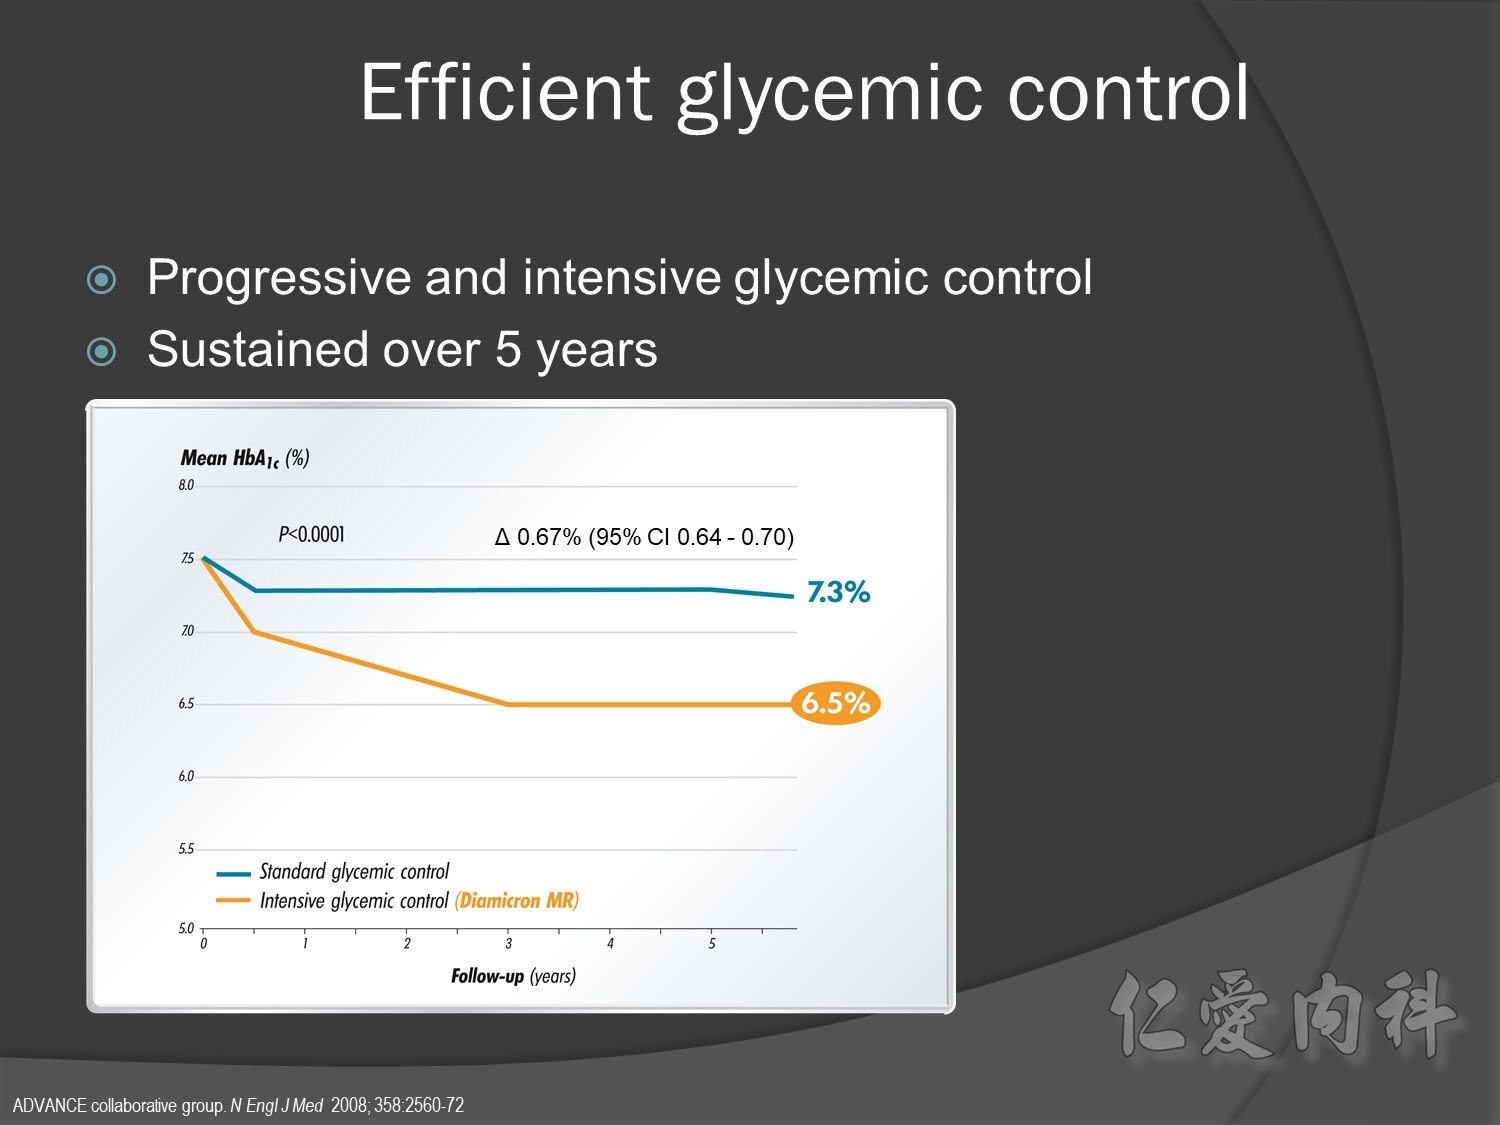
Intensive Vs conventional glycermic control, patient compliance
Intensive control à10% Significant reduction in the combined risk of micro- and macrovascular events
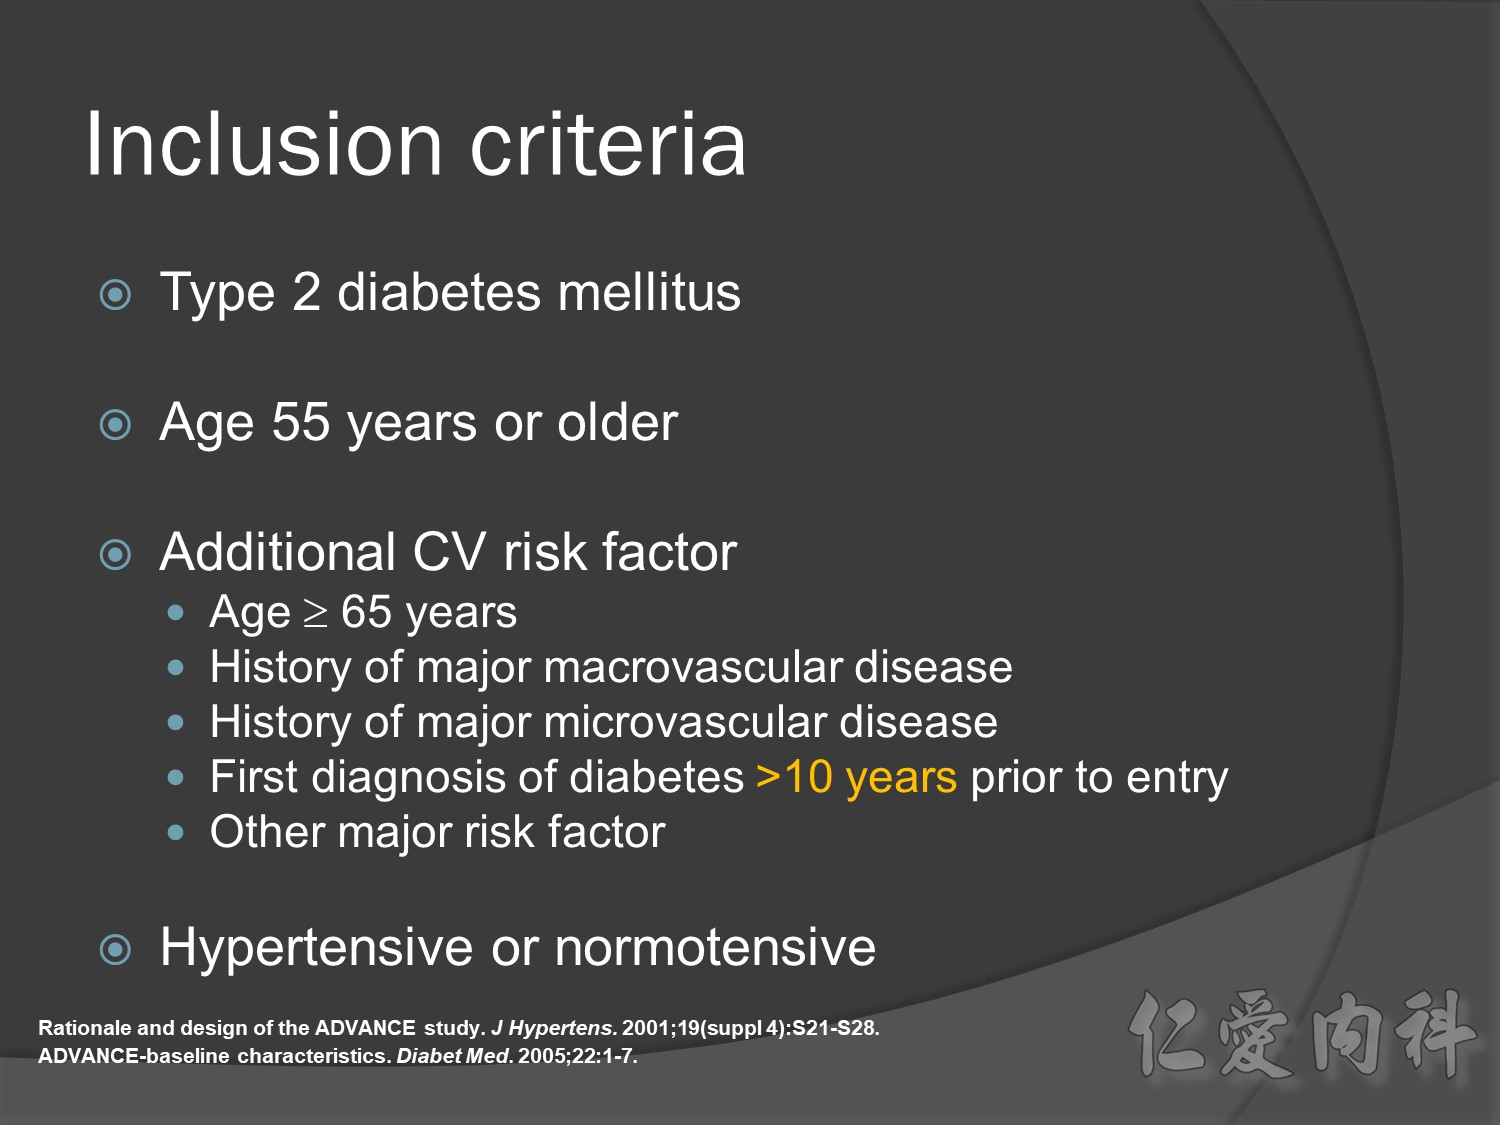
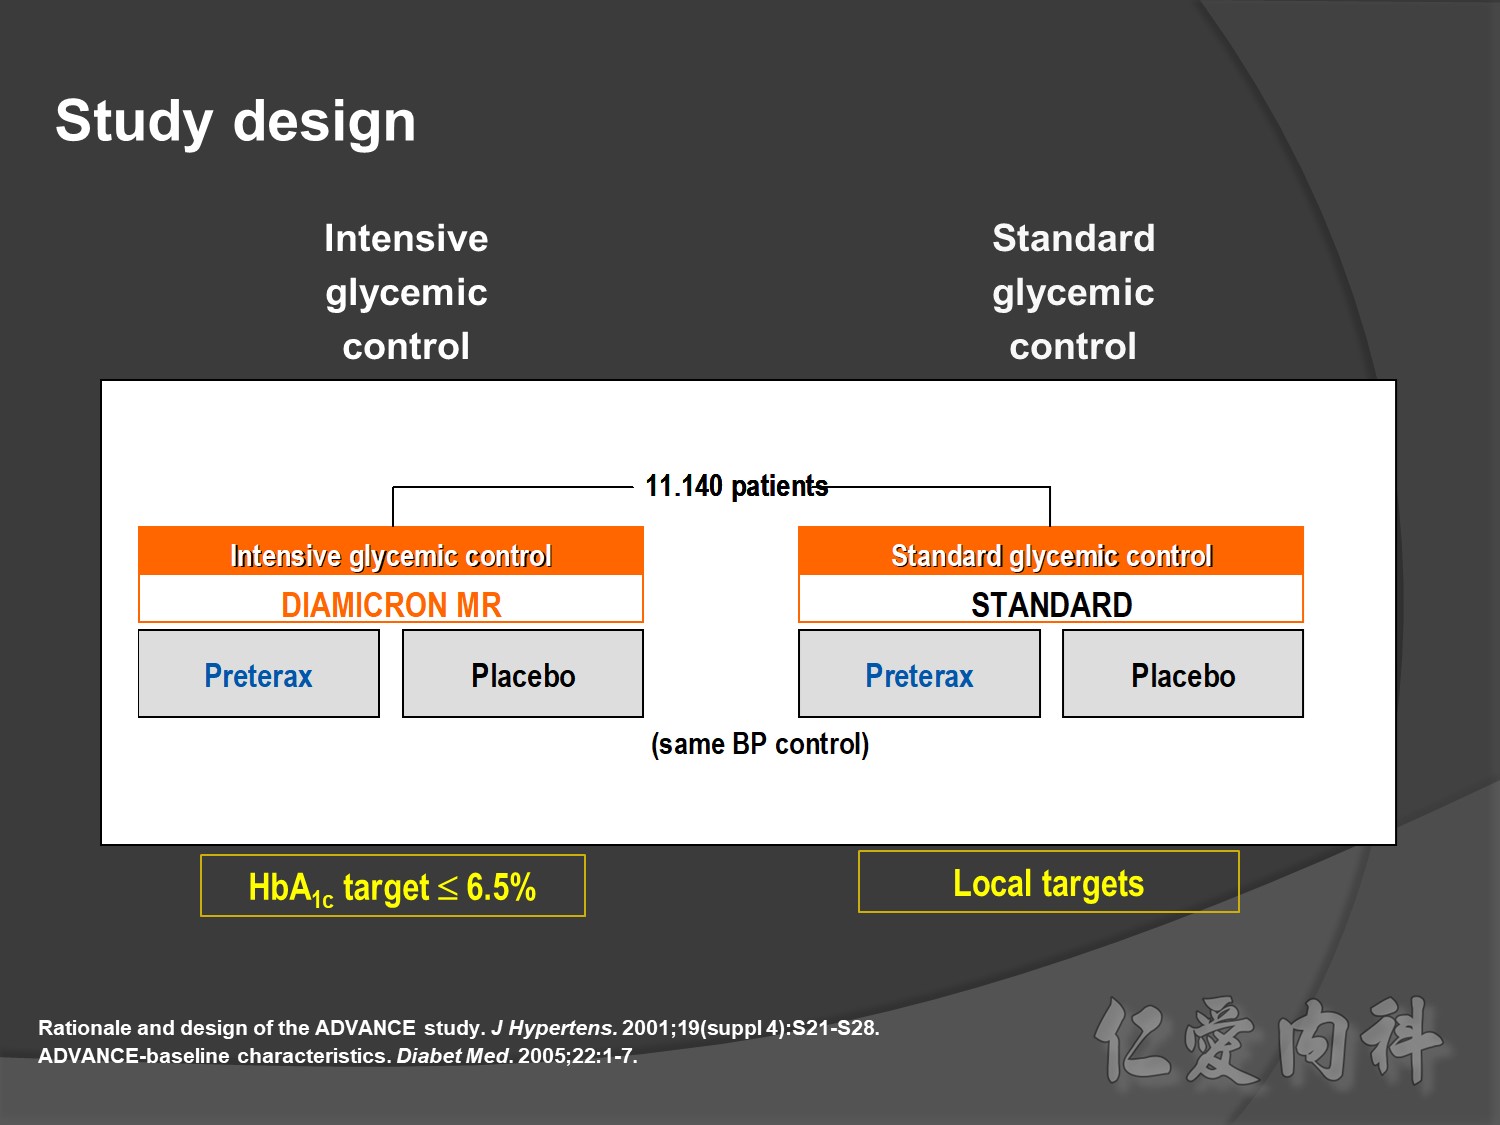
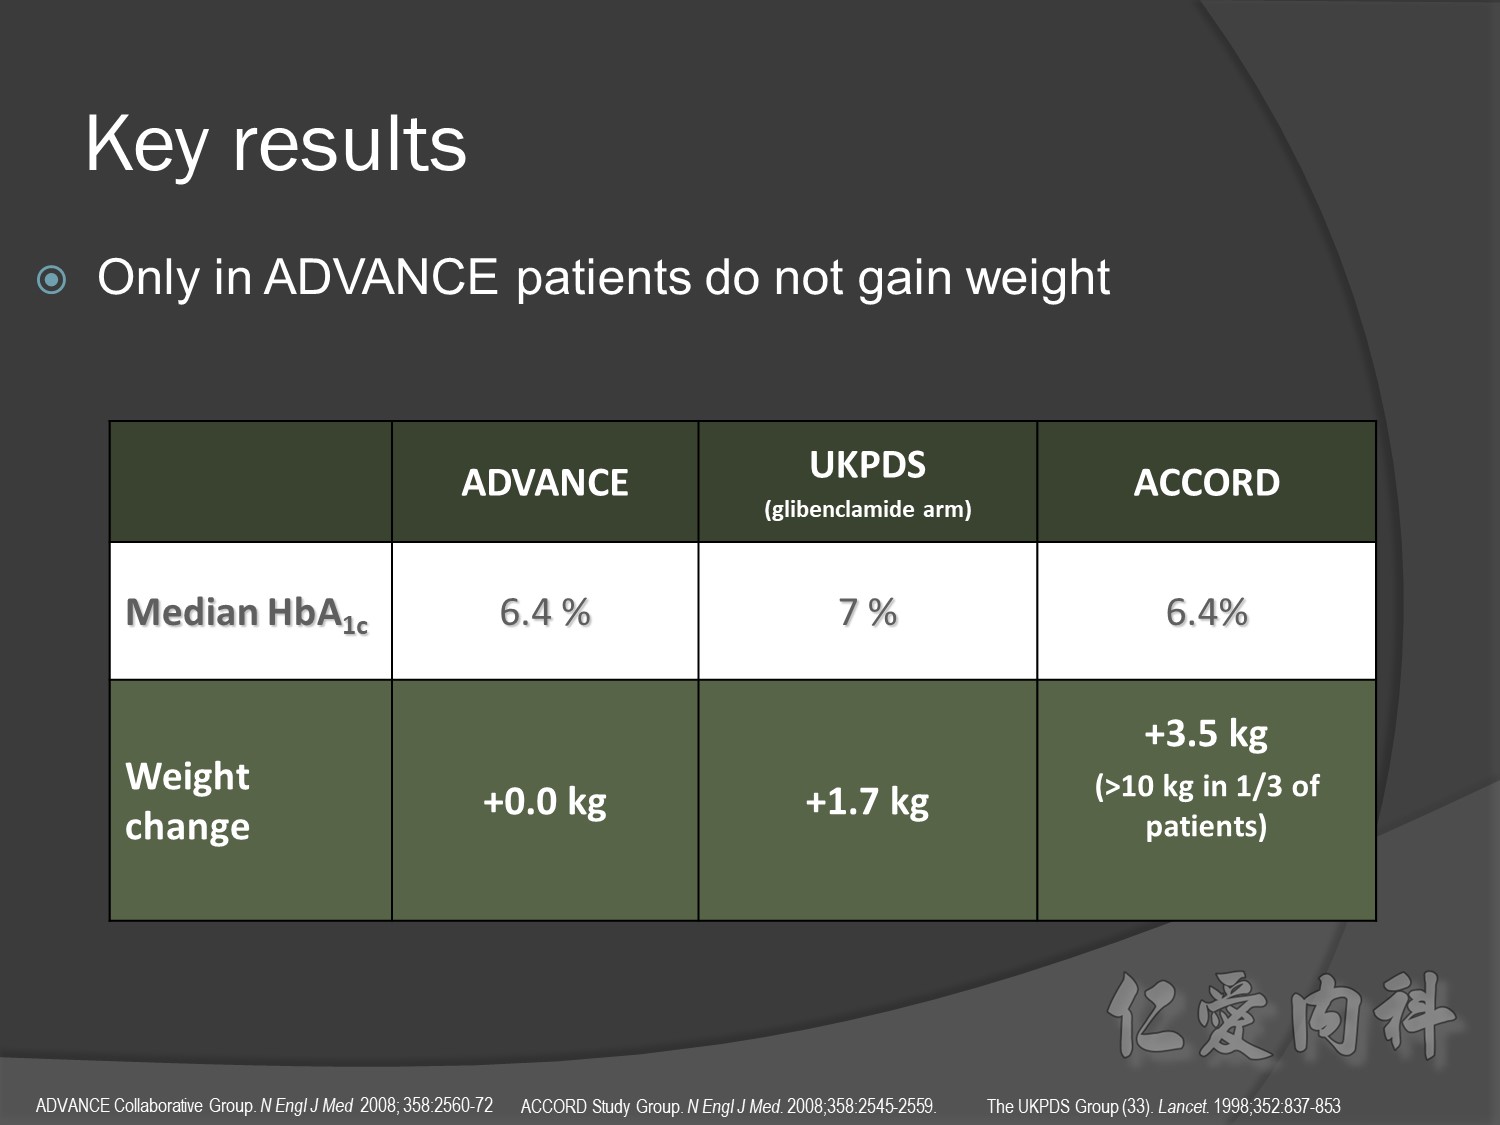
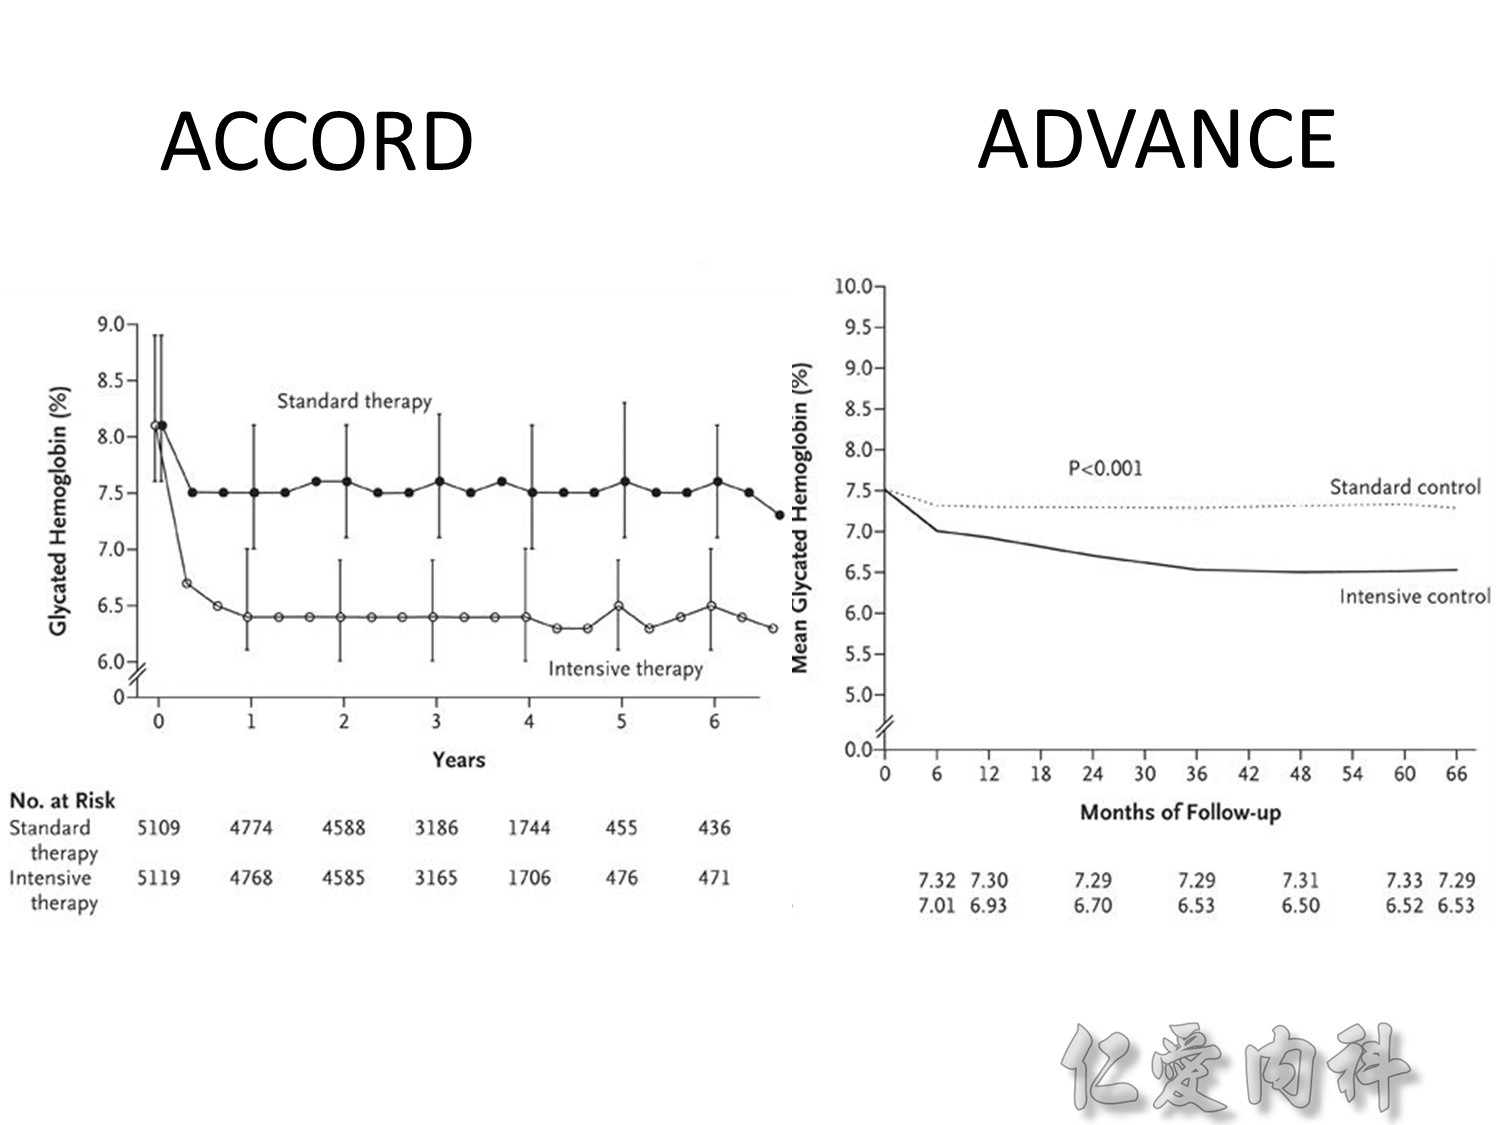
ADVANCE, with more than 11 000 patients, is the largest ever prospective study carried out in type 2 diabetes for the prevention of vascular disease.
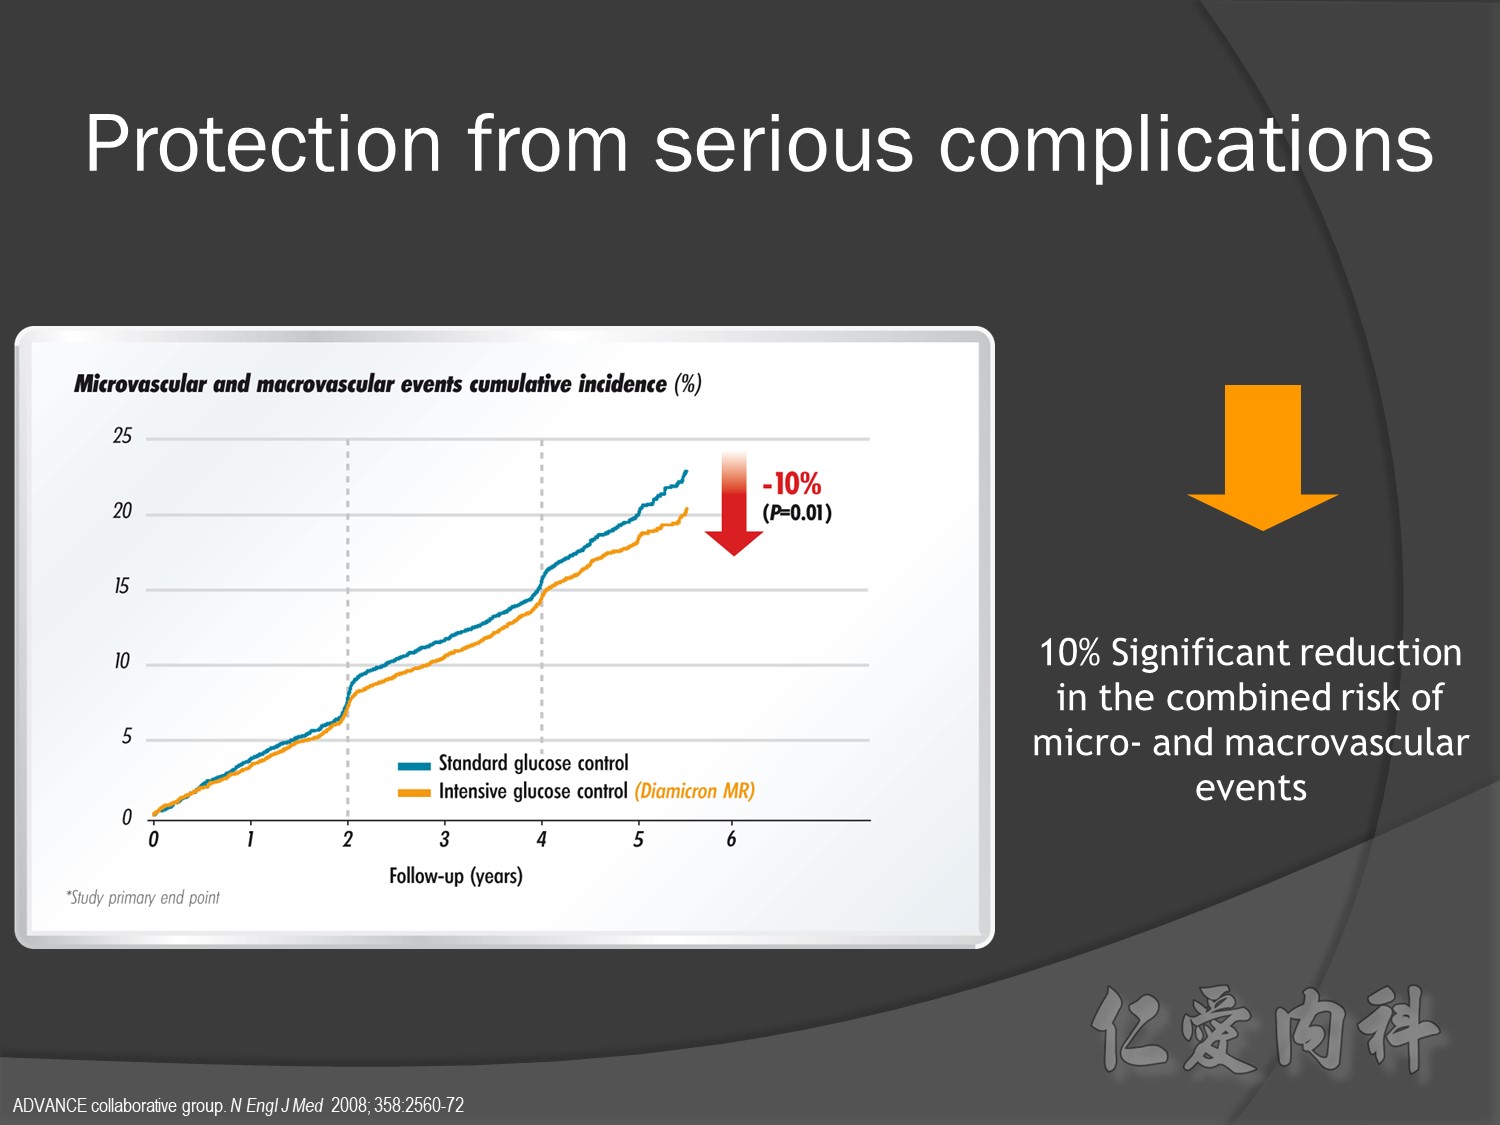
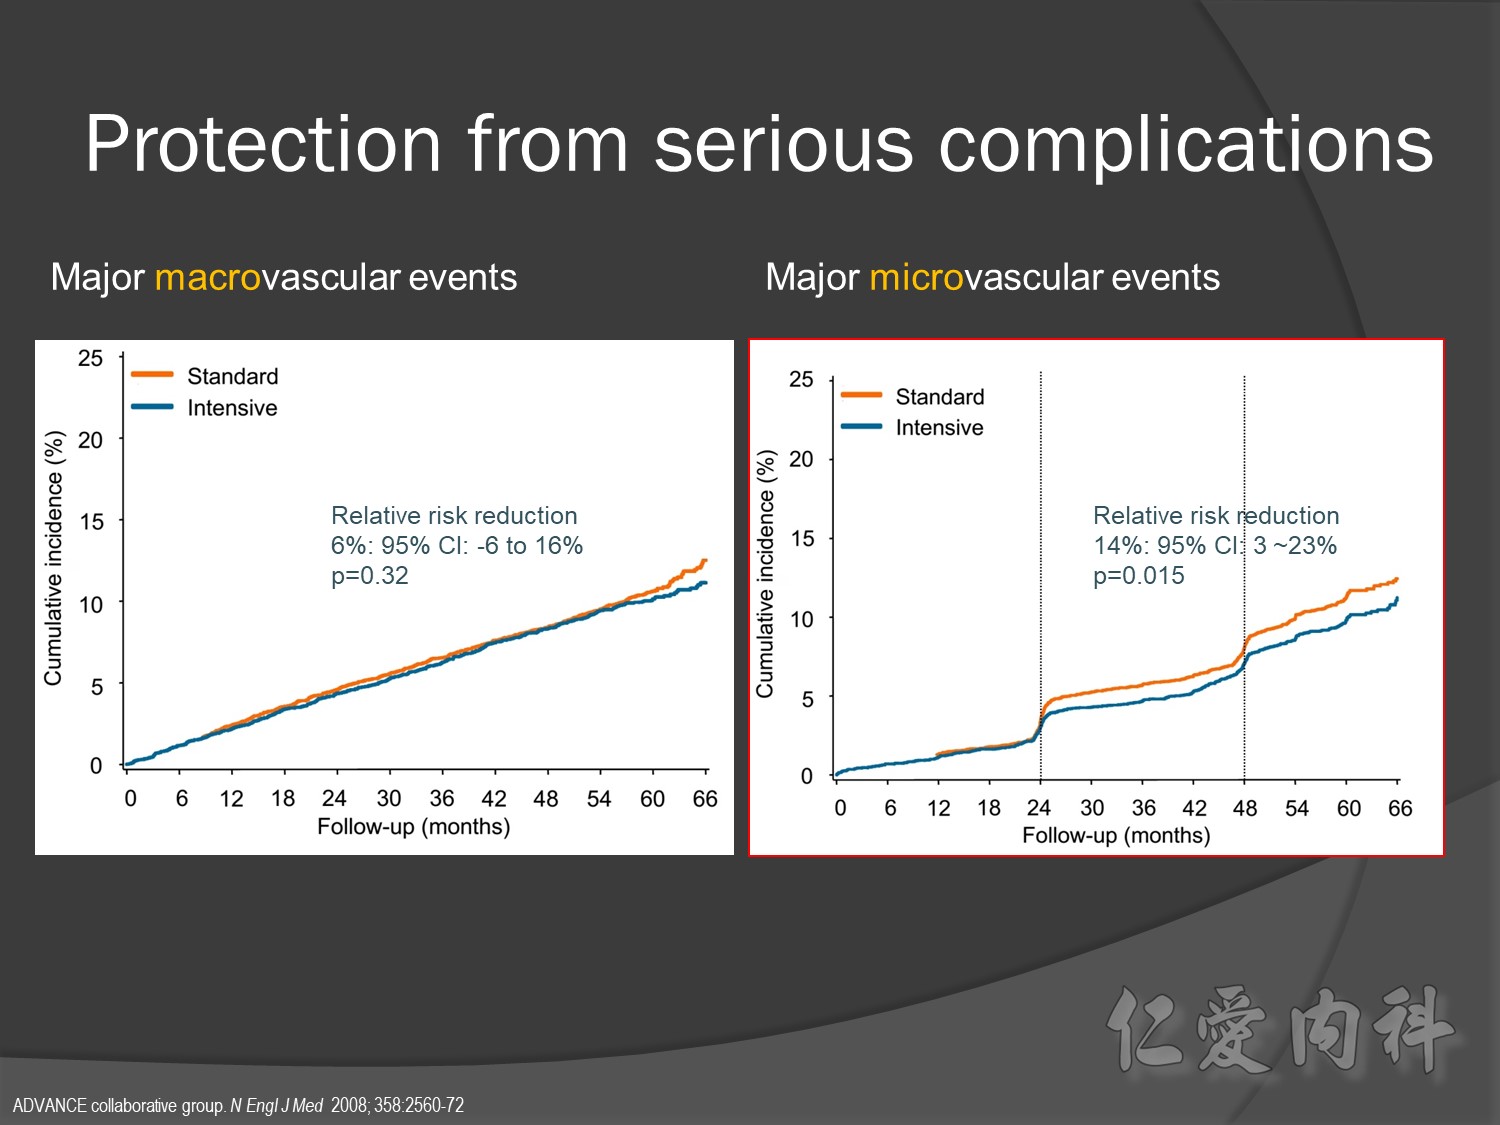
Serous complication reduce more in intensive control microvascular events (MACE)more than microvascular events in following 66 months

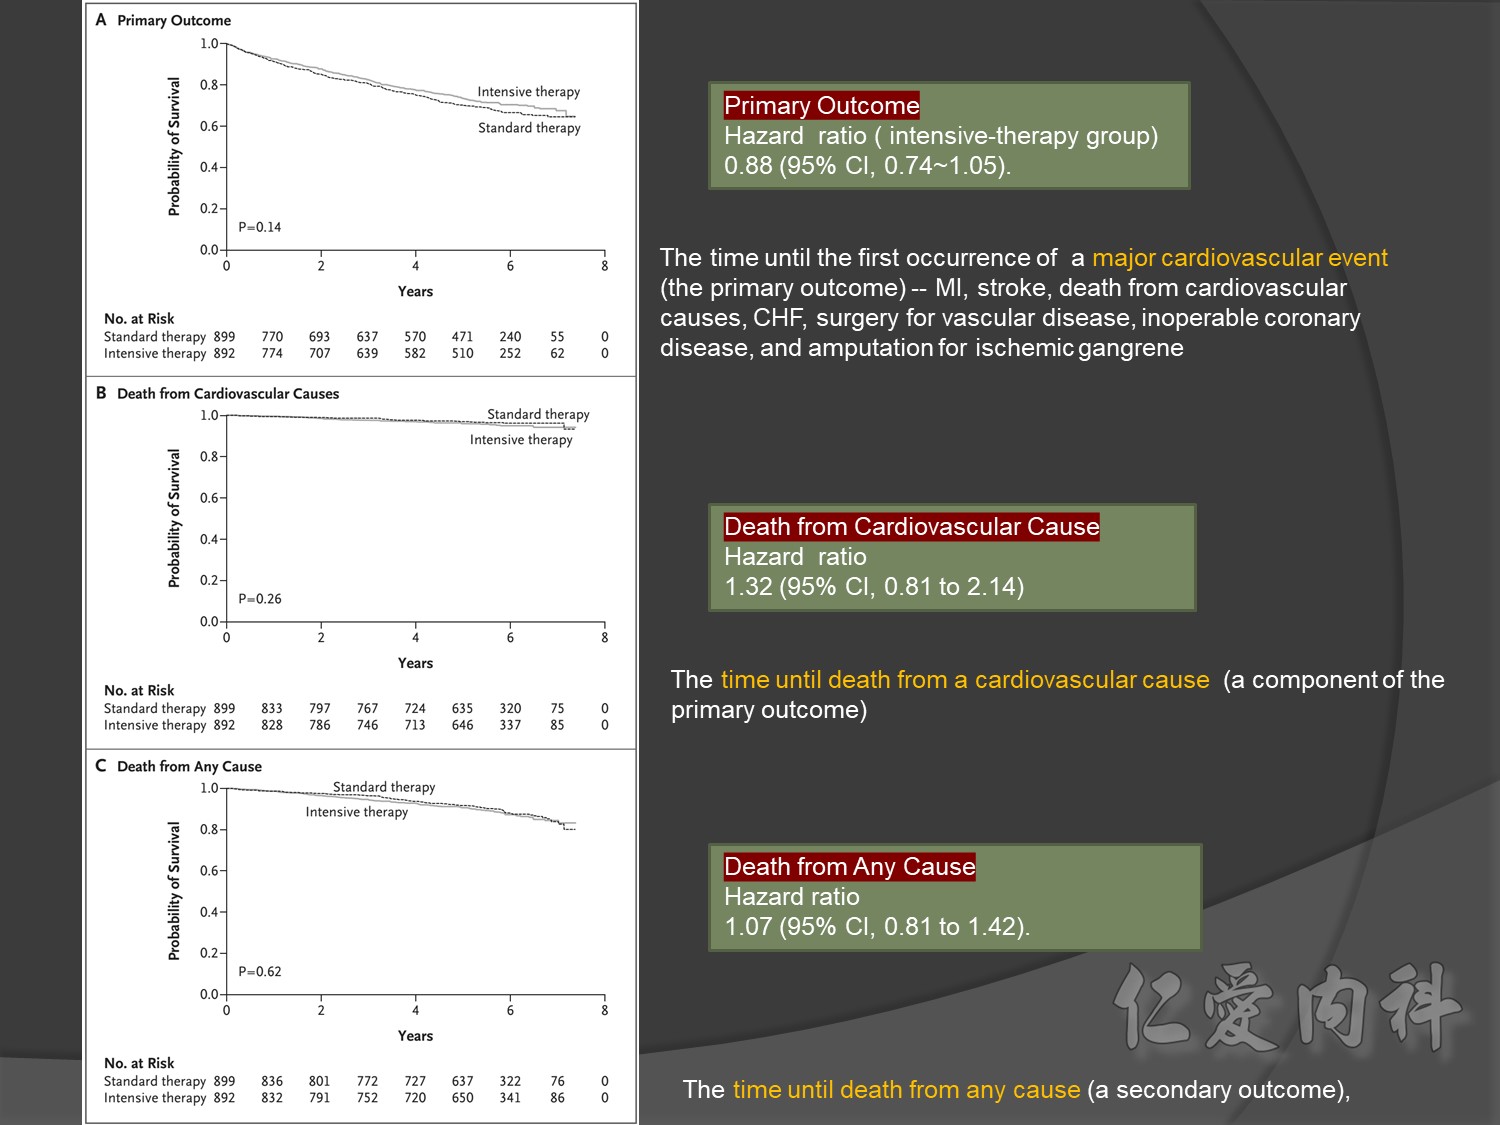
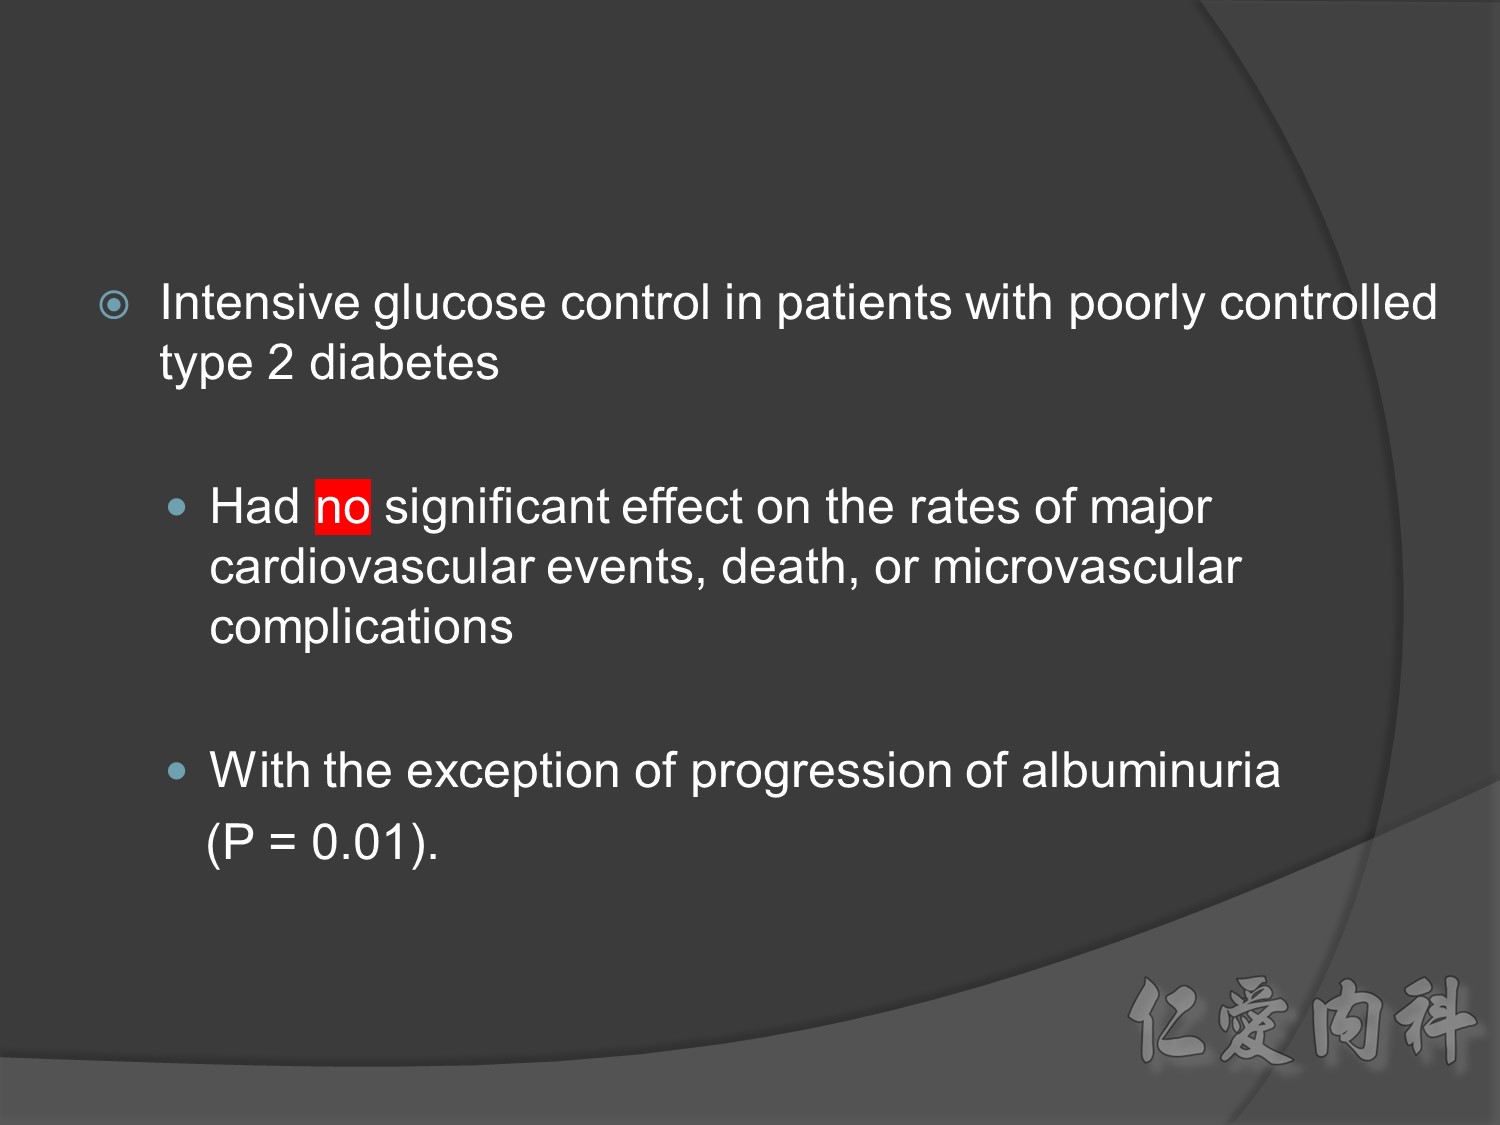
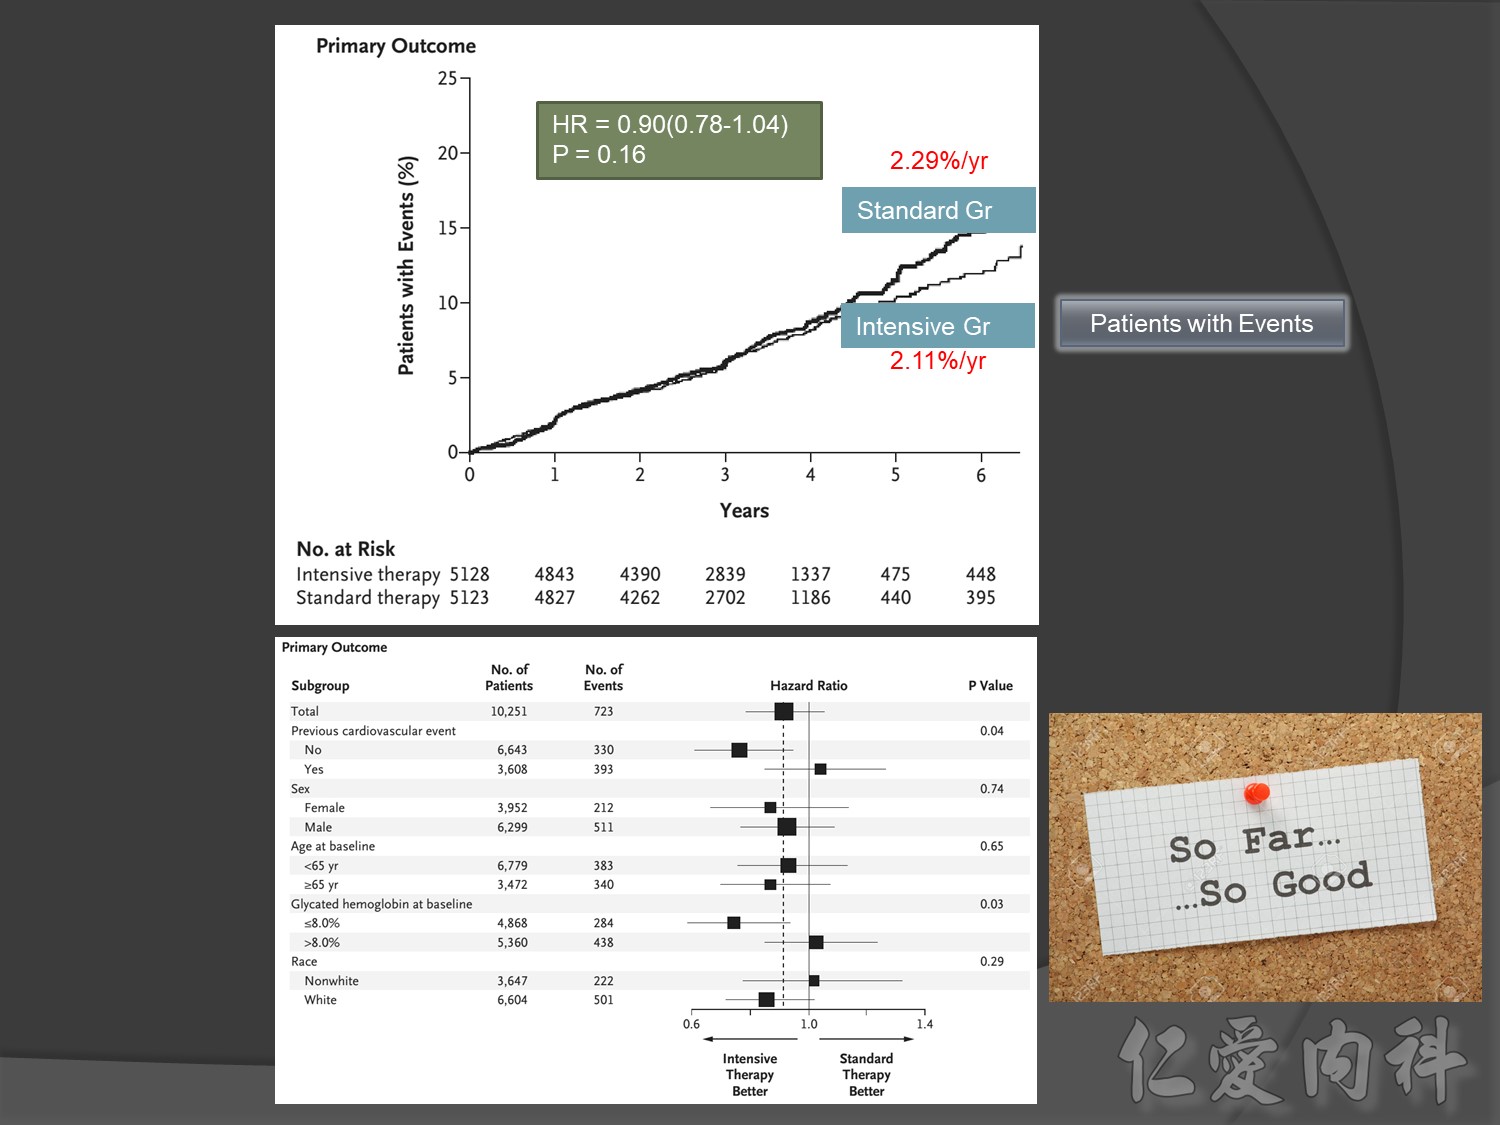
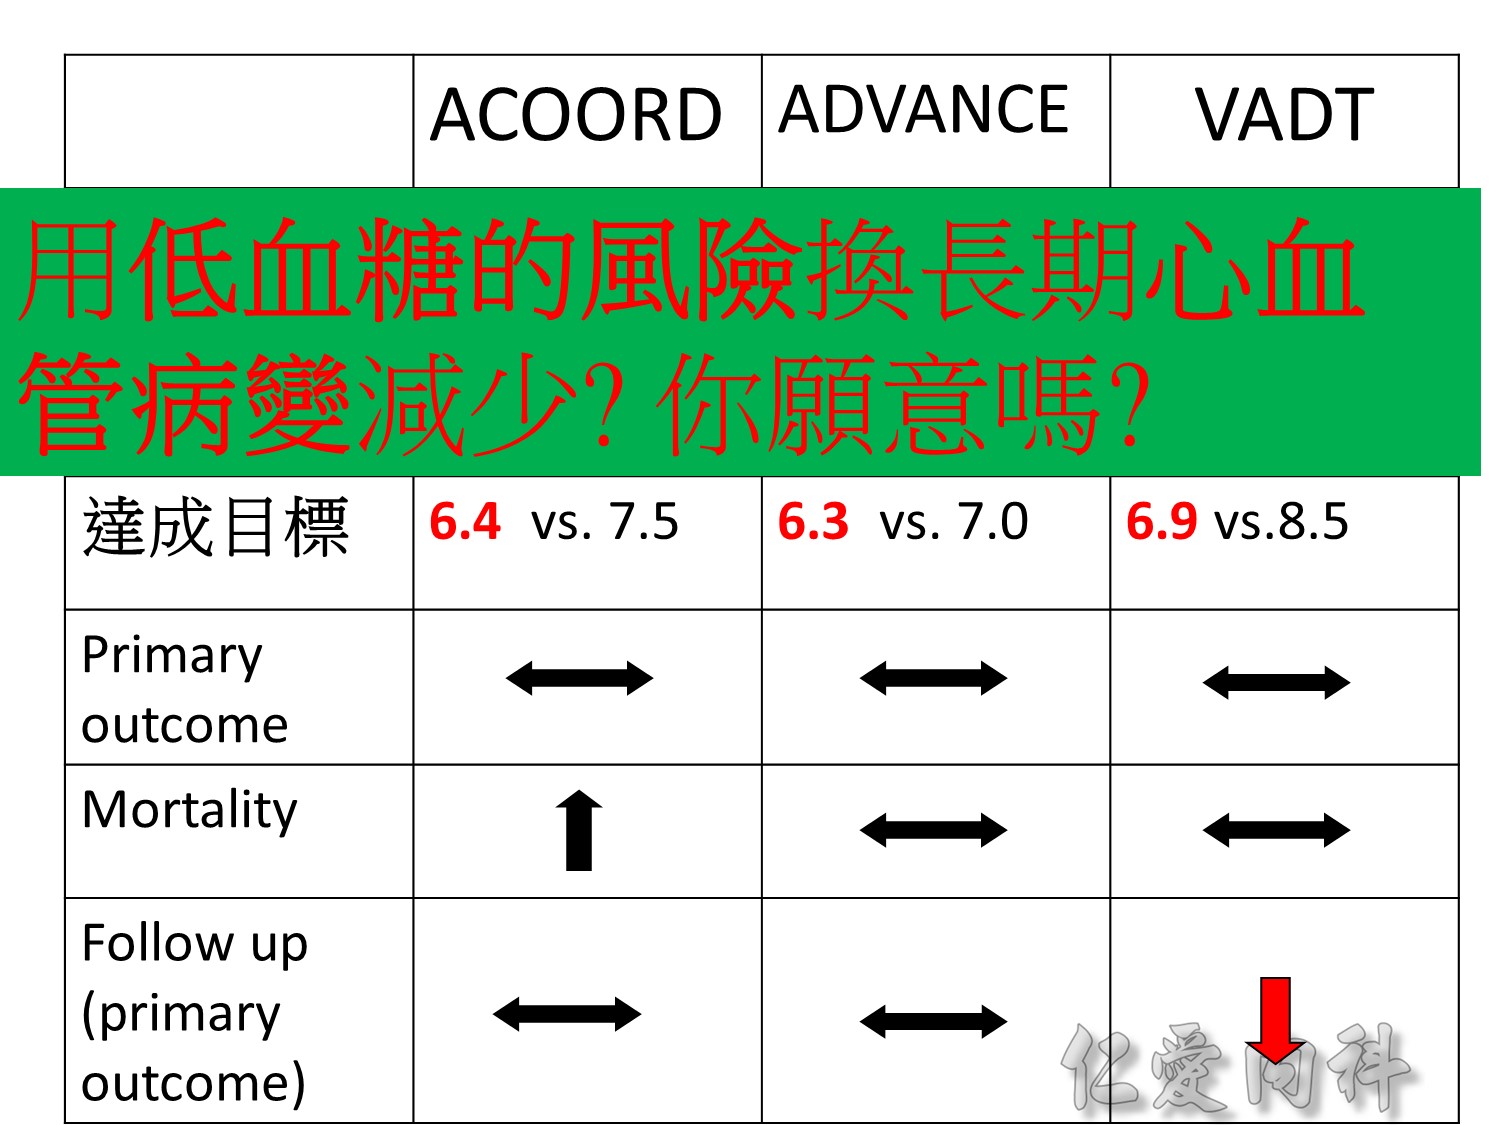
Primary outcomes(daeth , MACE and microvascualr complications) à no changes
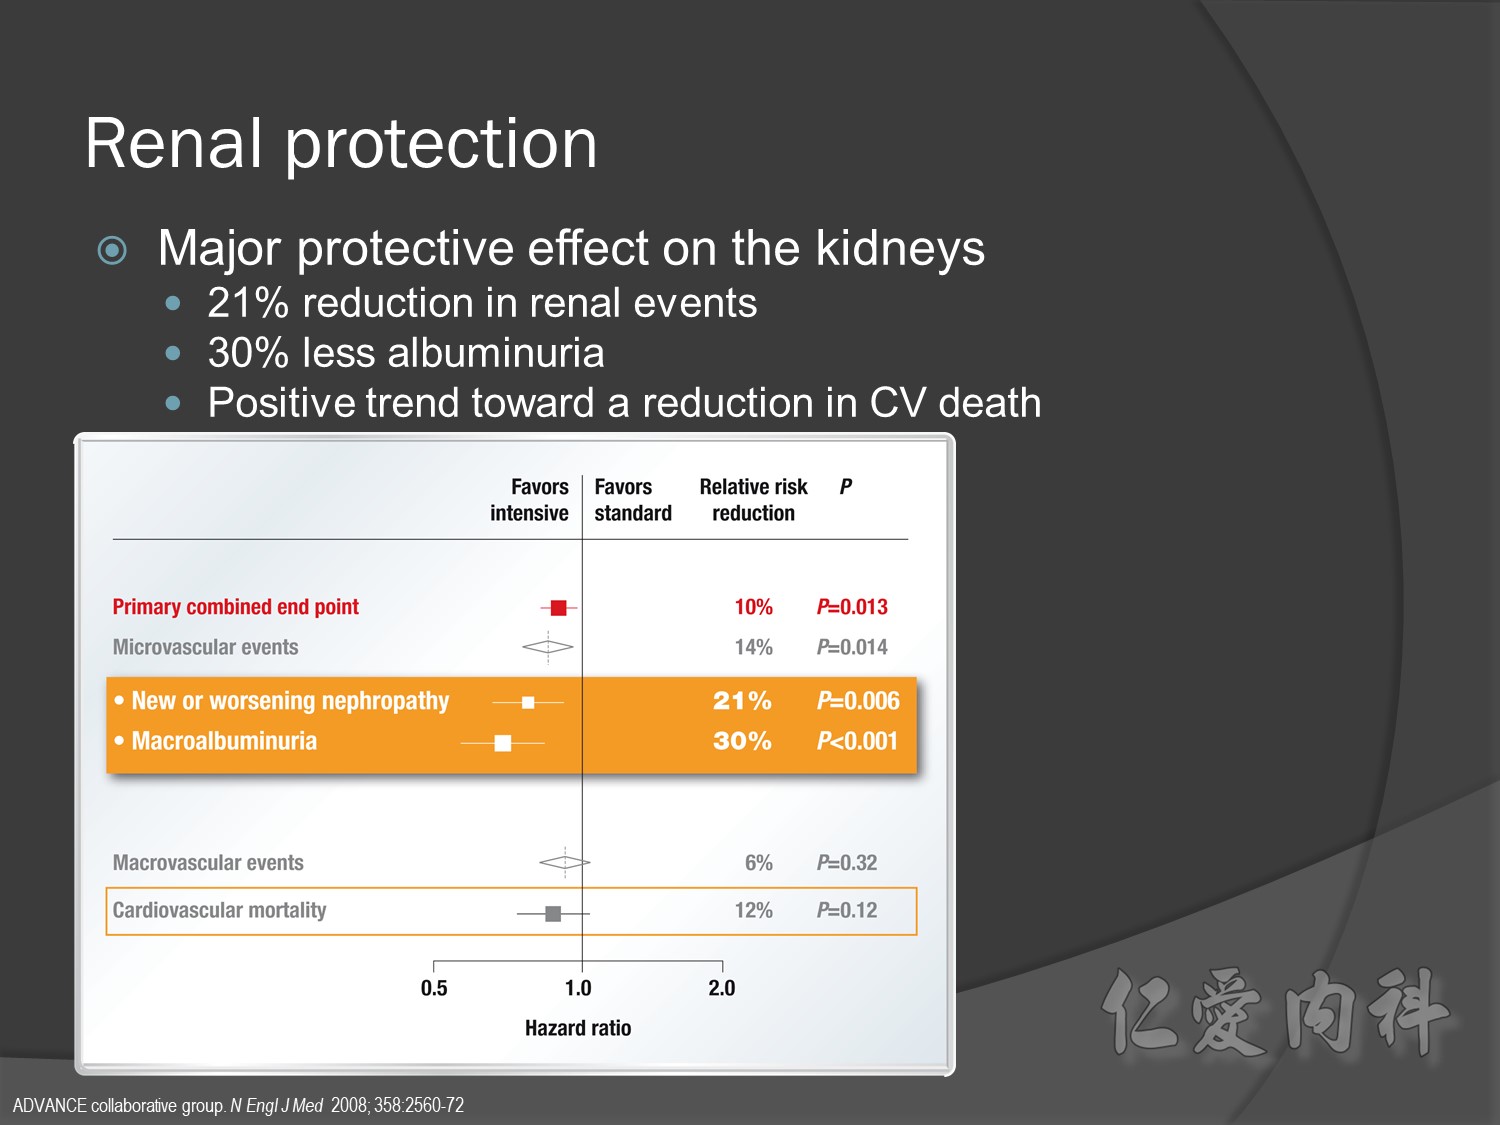
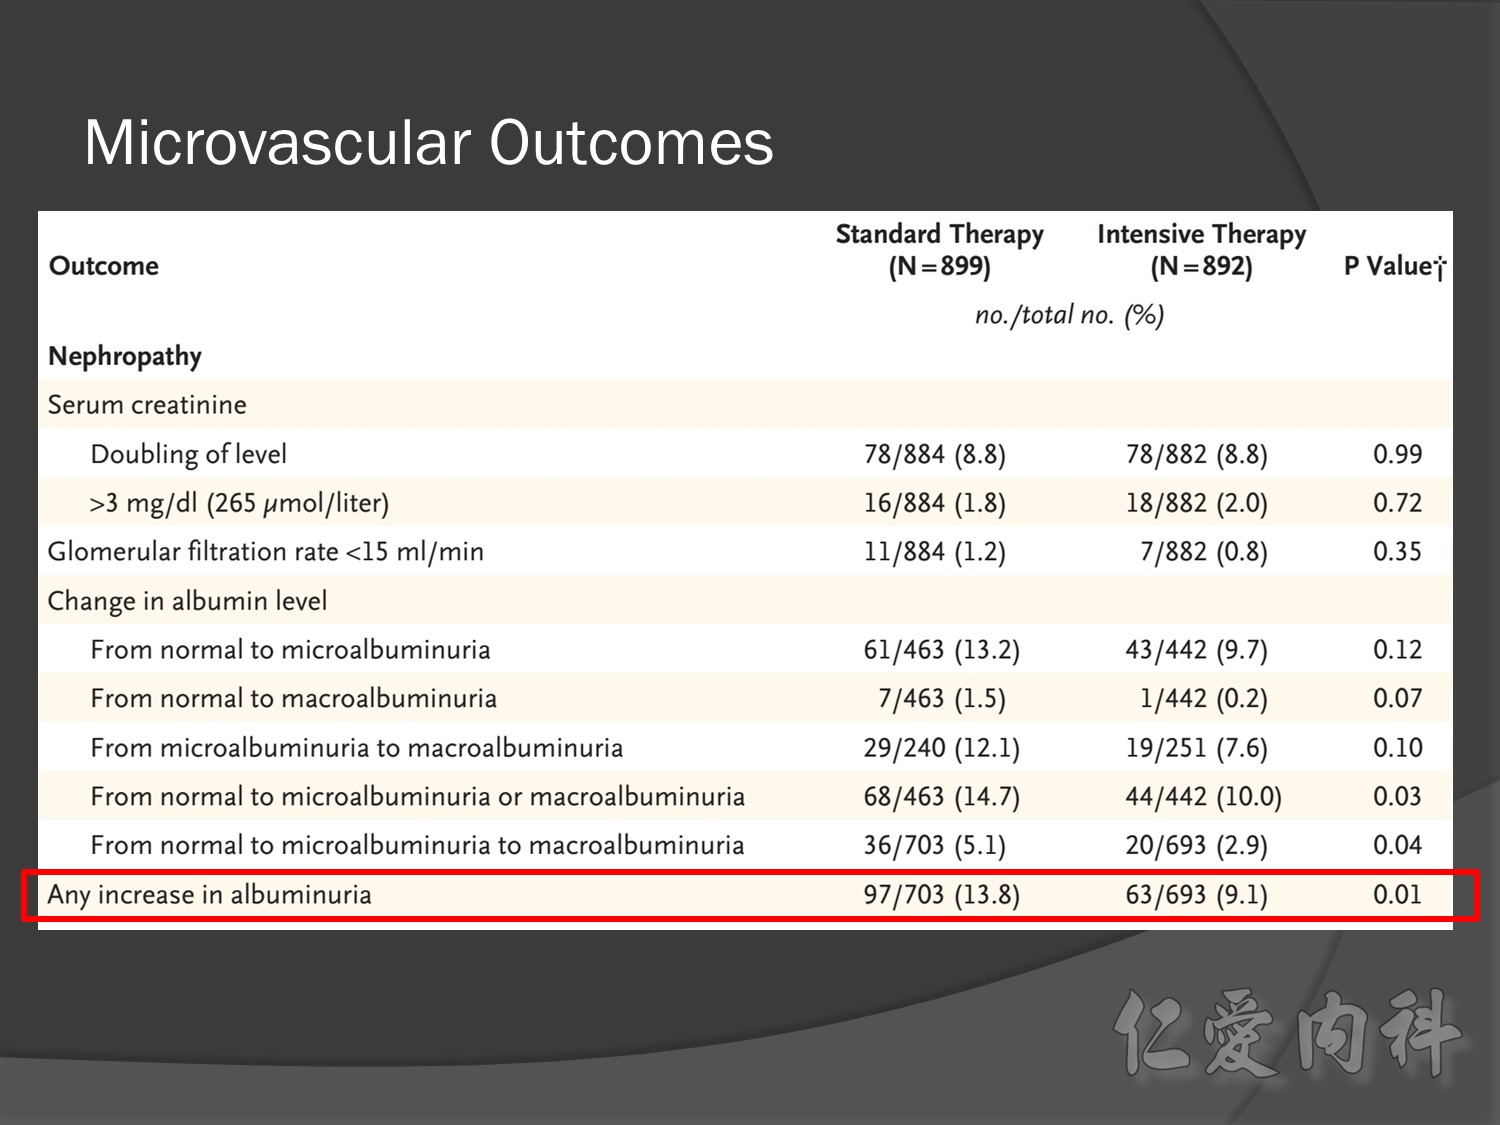
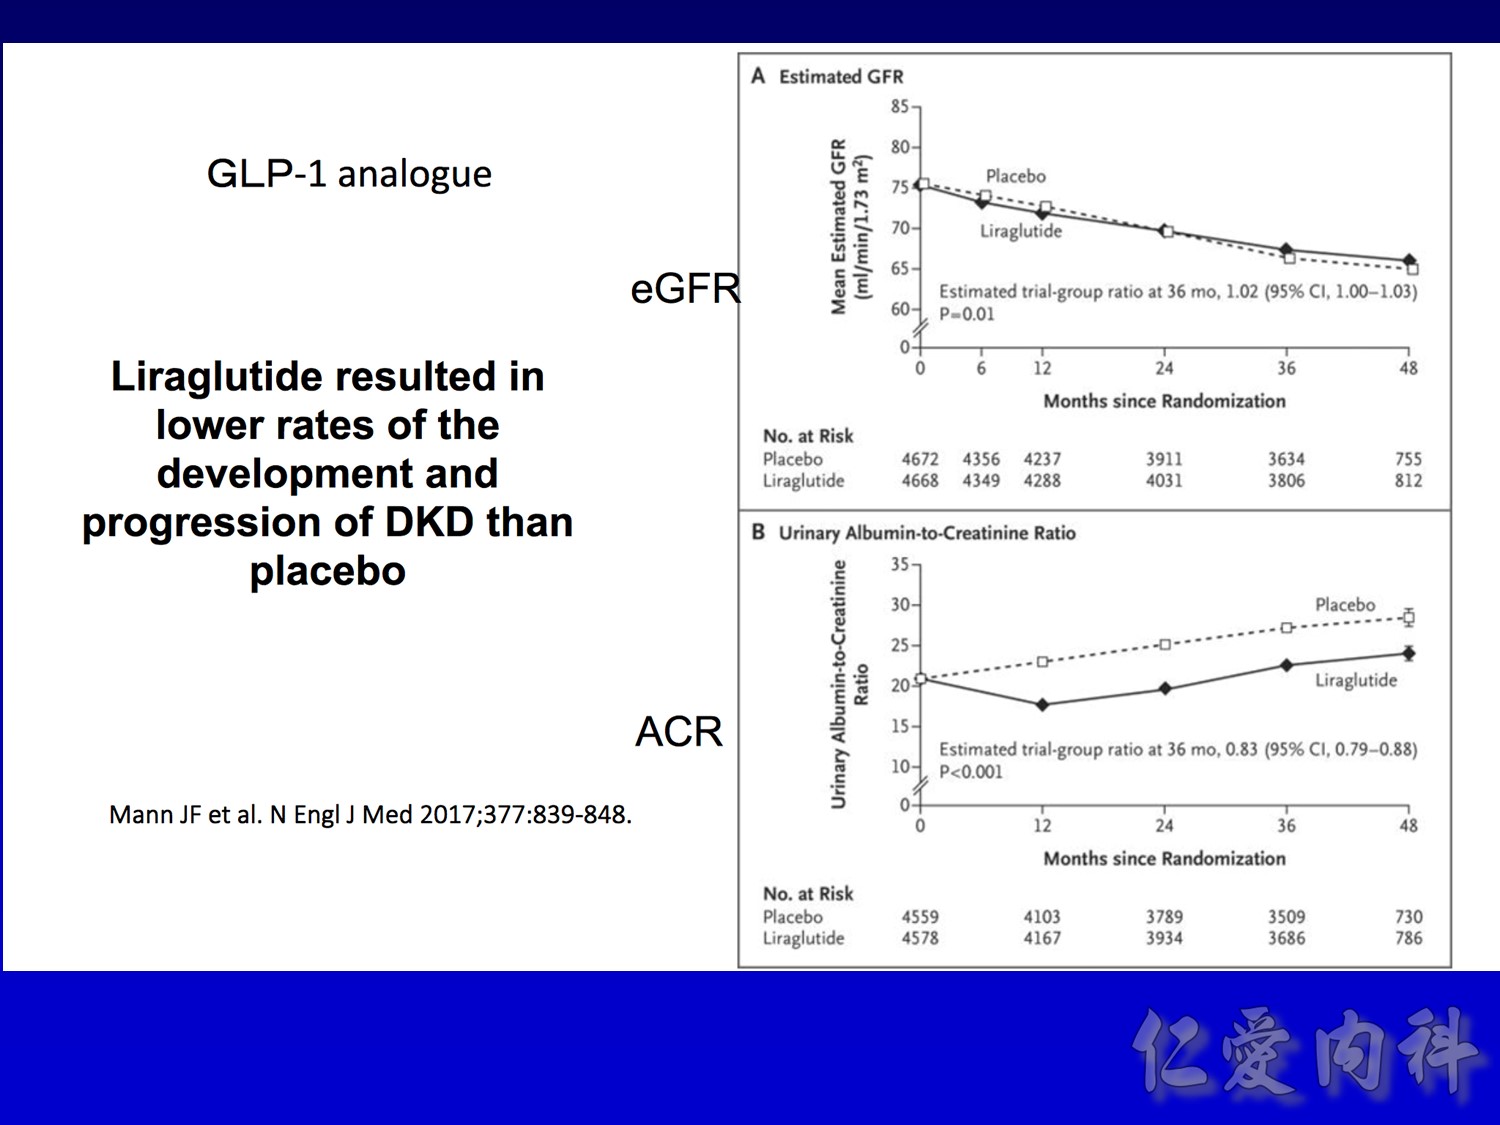
But for progress of albuminemia à might help
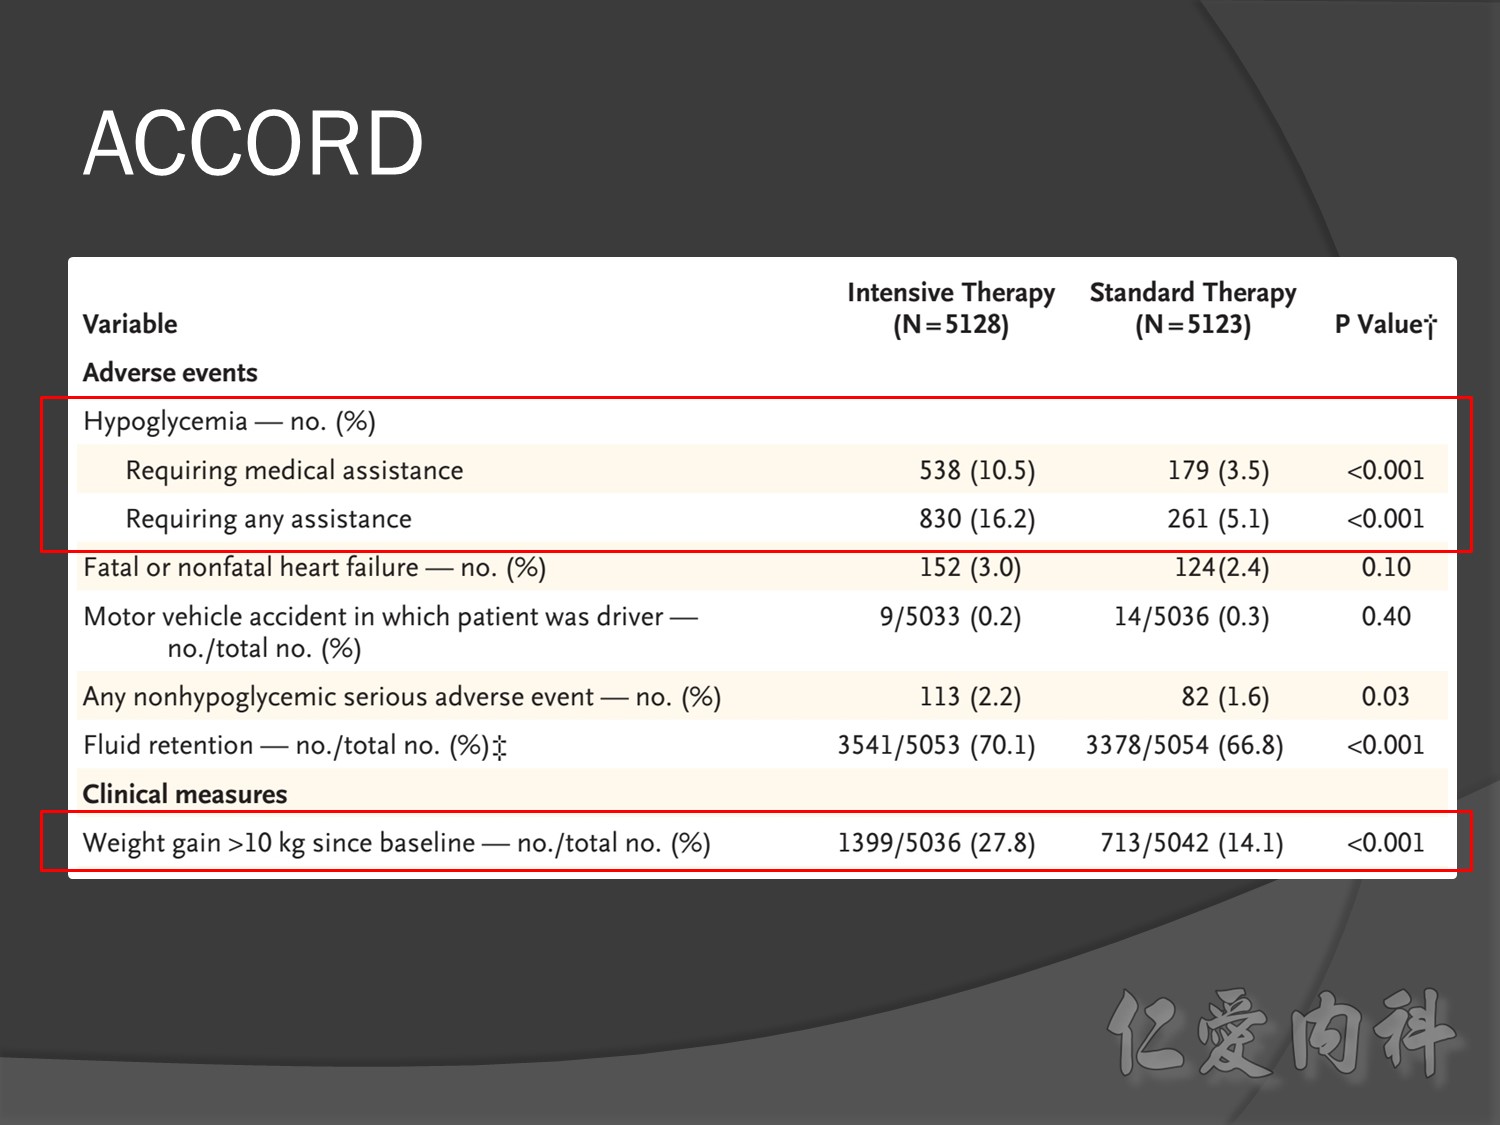
Group of high risk patient of CV event s but better renal function in Accord study
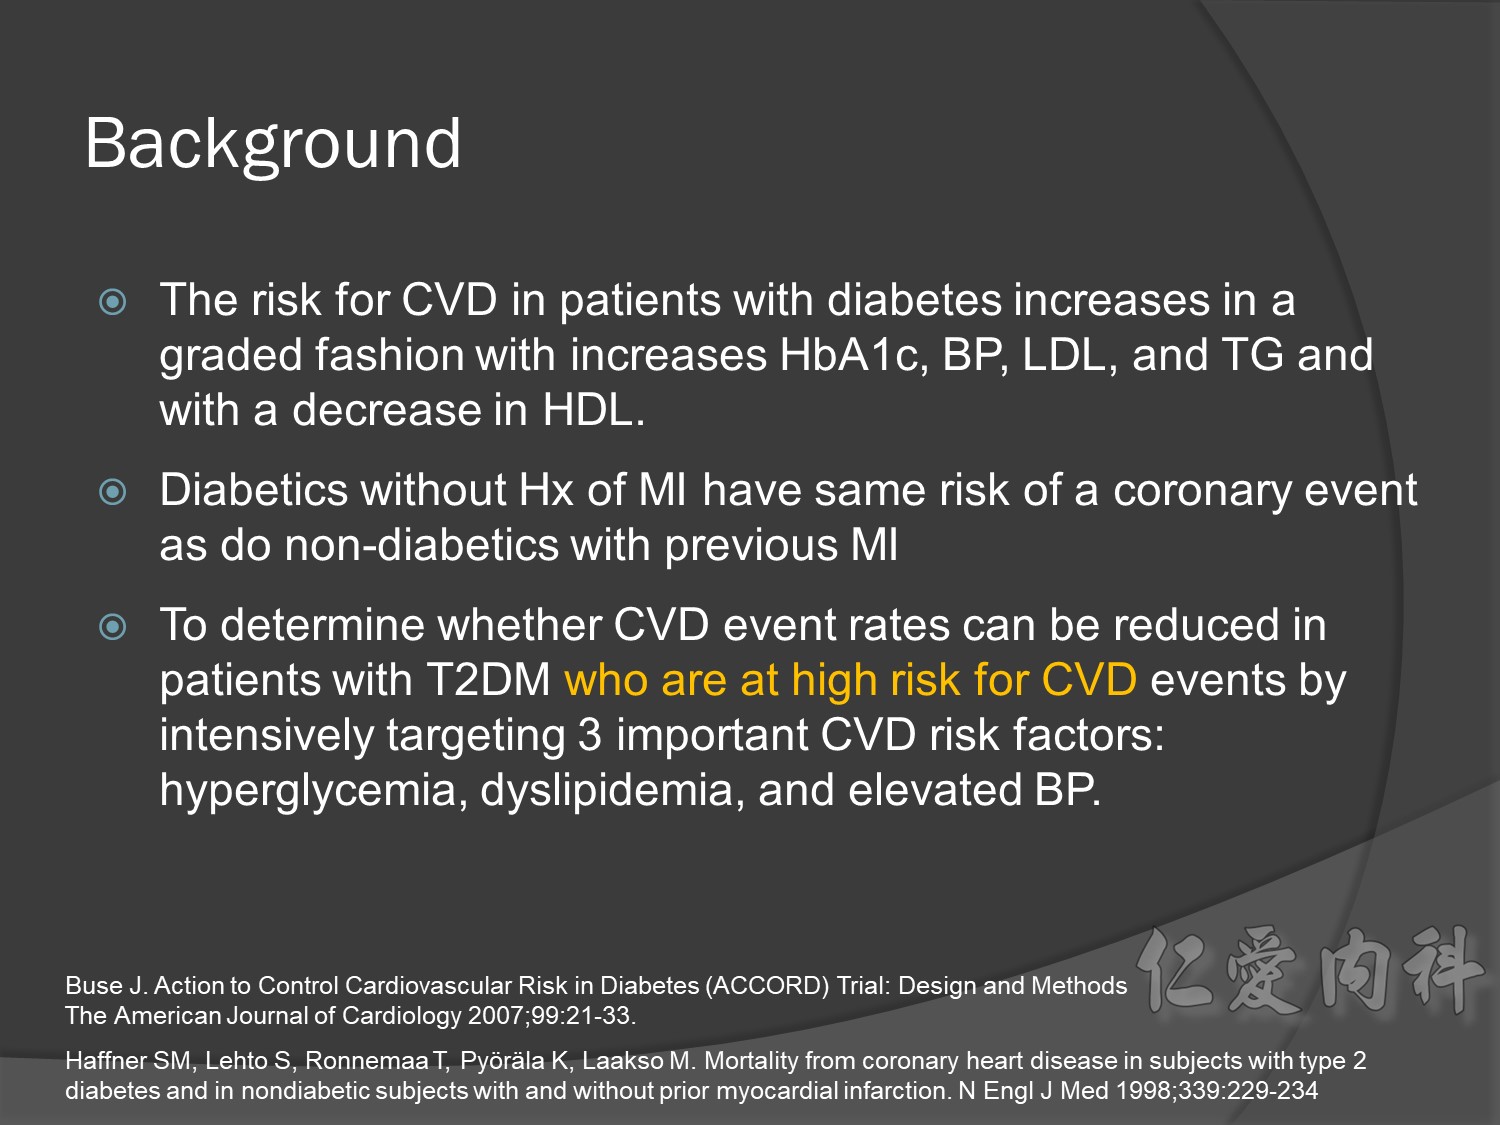
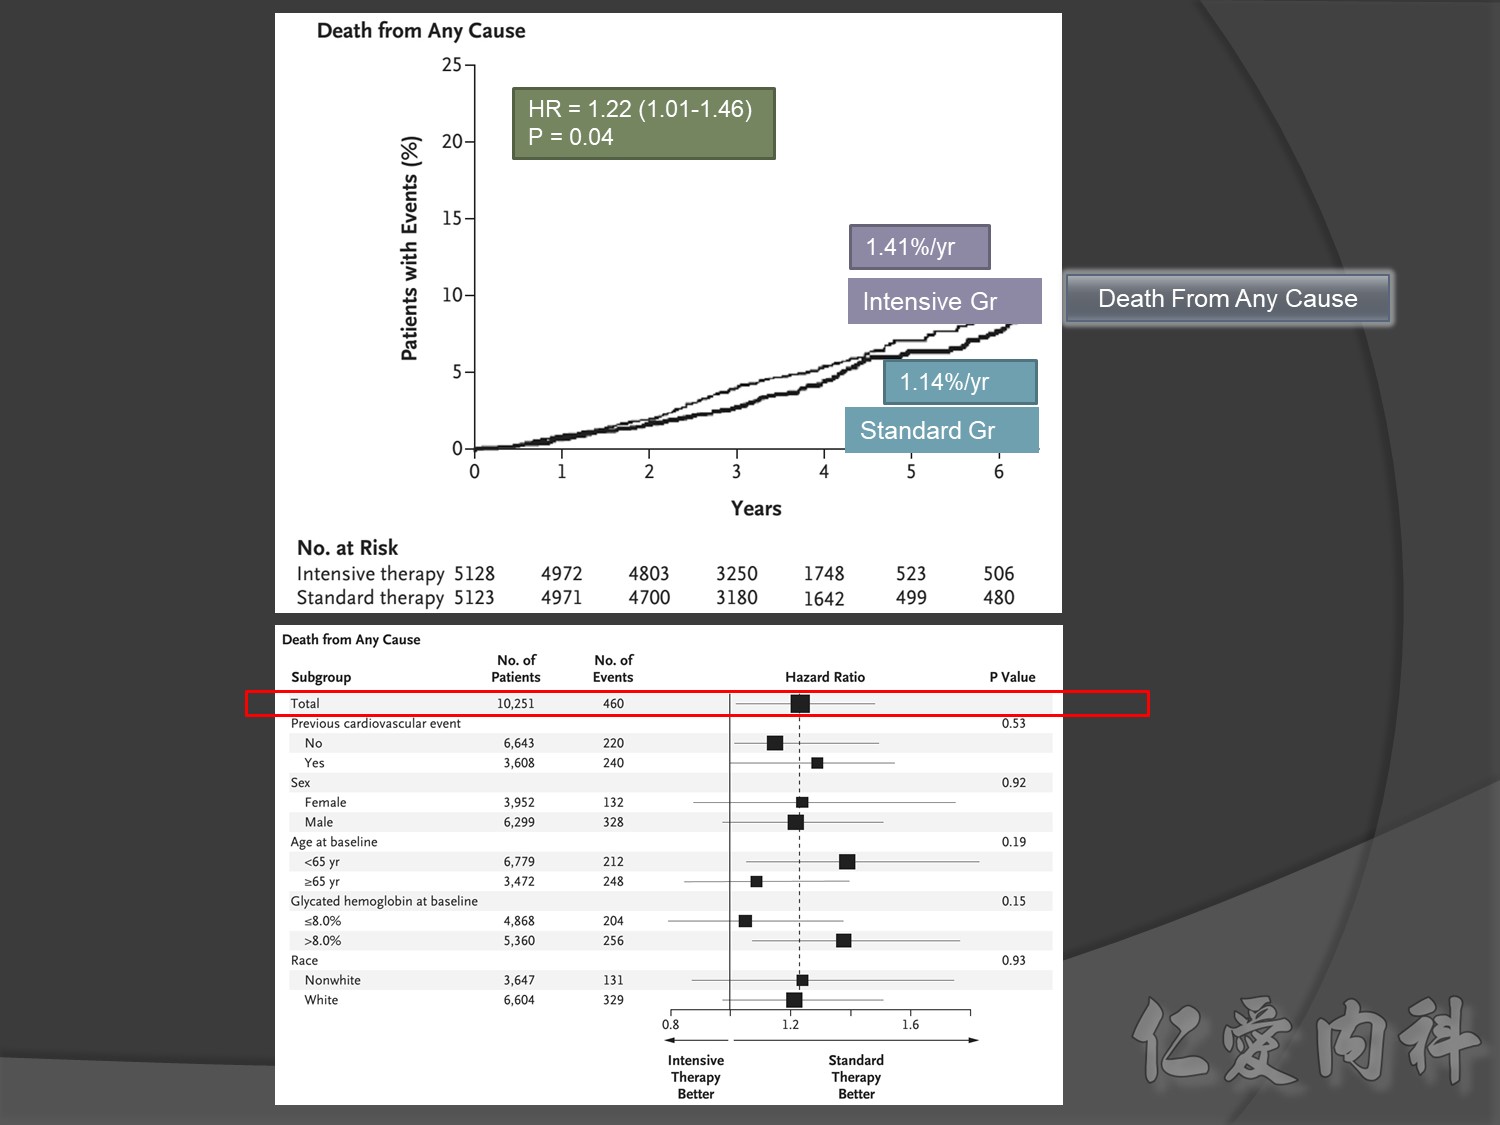
cardiovascular causes included death from myocardial infarction, heart failure, arrhythmia, invasive cardiovascular interventions, cardiovascular causes after noncardiovascular surgery, stroke, unexpected death presumed to be from ischemic cardiovascular disease occurring within 24 hours after the onset of symptoms, and death from other vascular diseases
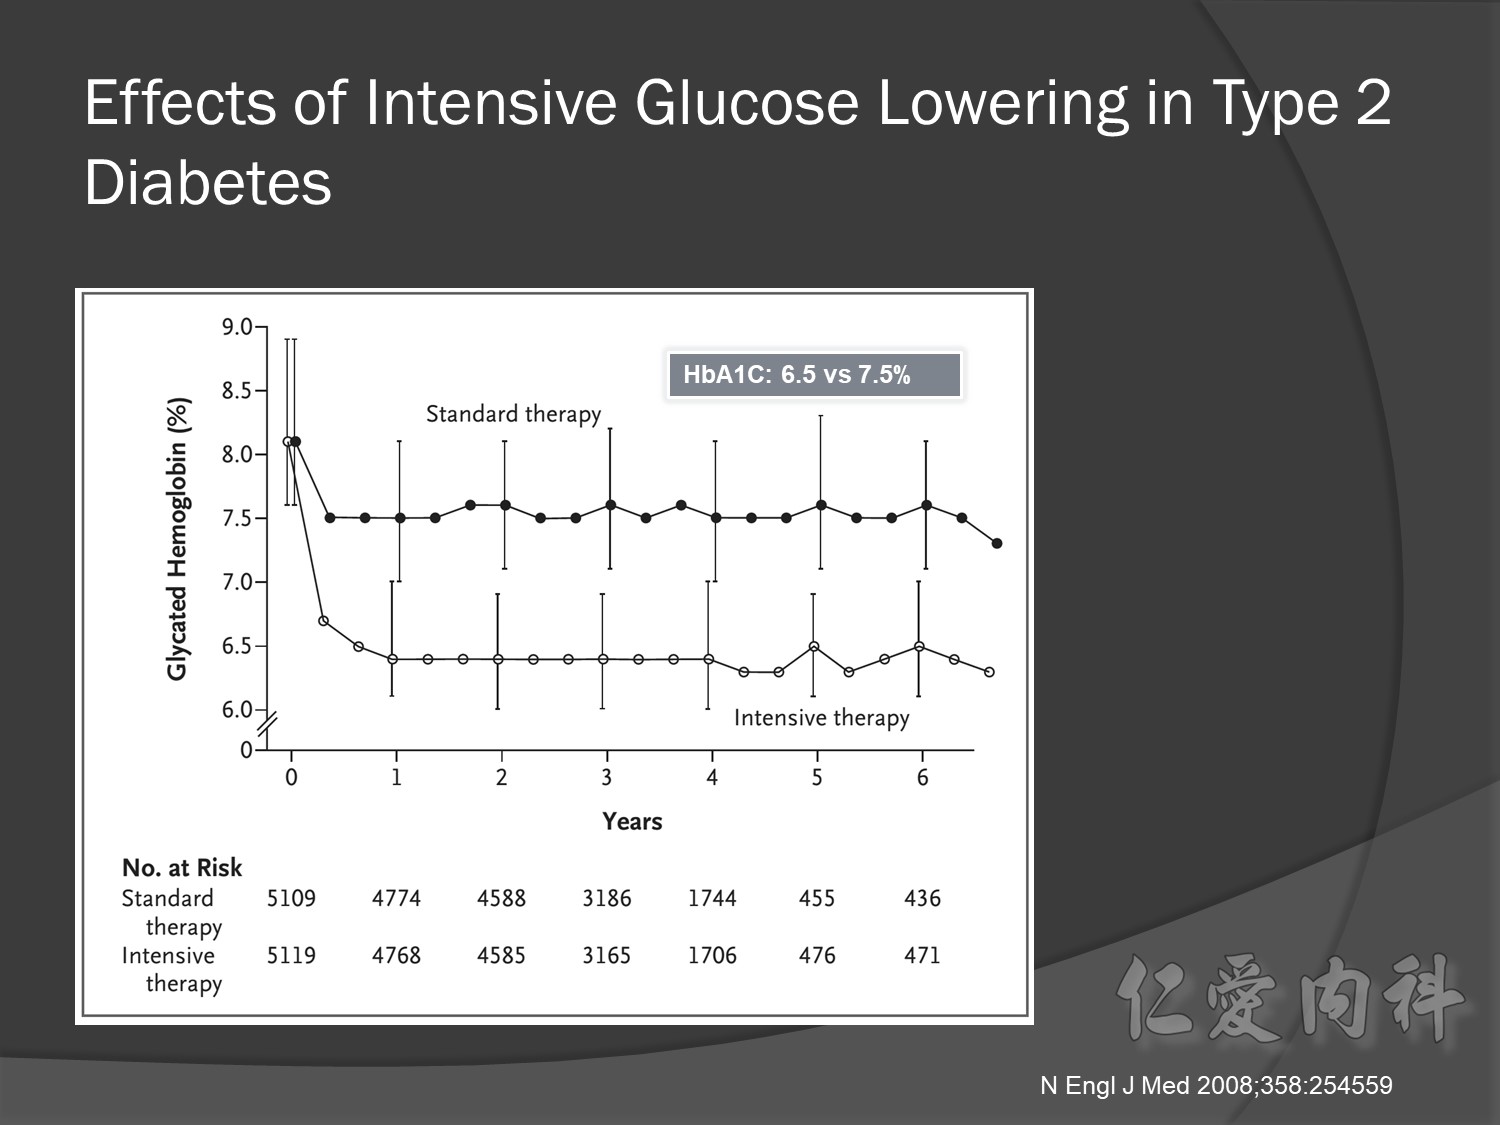
Intensive glycermic control group àincreasing all cause mortality


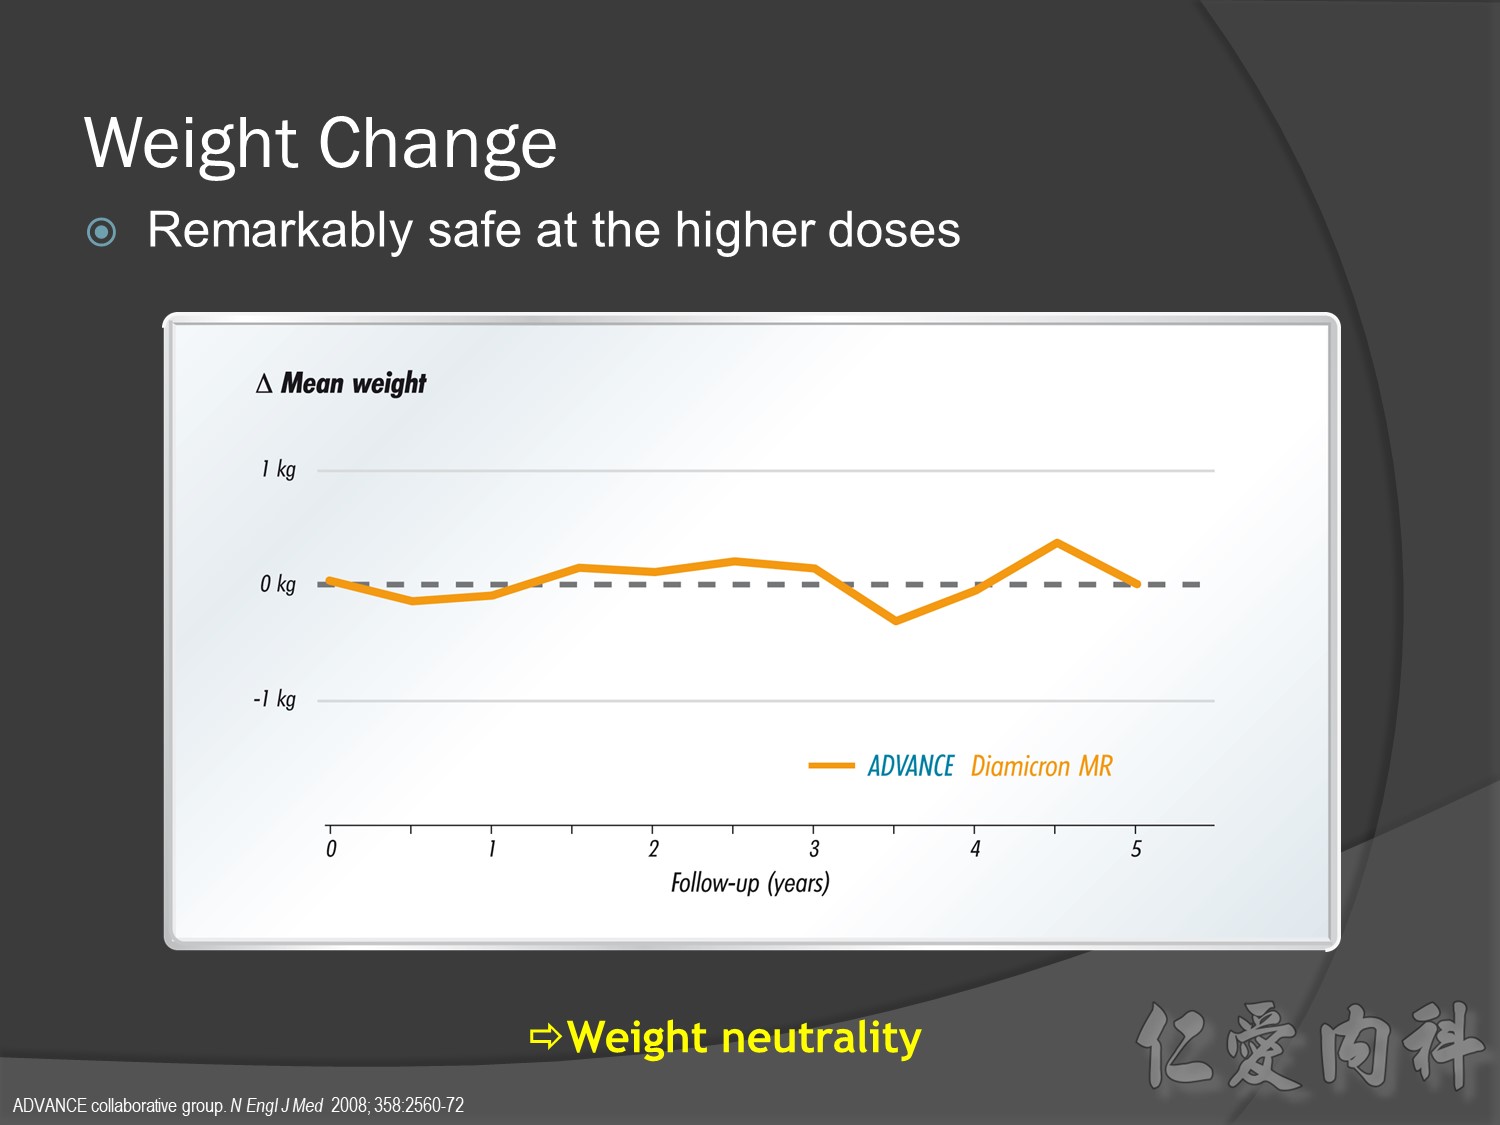
What makes the use of Diamicron MR extremely rational in ADVANCE?
Four main reasons:
What makes the use of Diamicron MR extremely rational in ADVANCE?
Four main reasons:

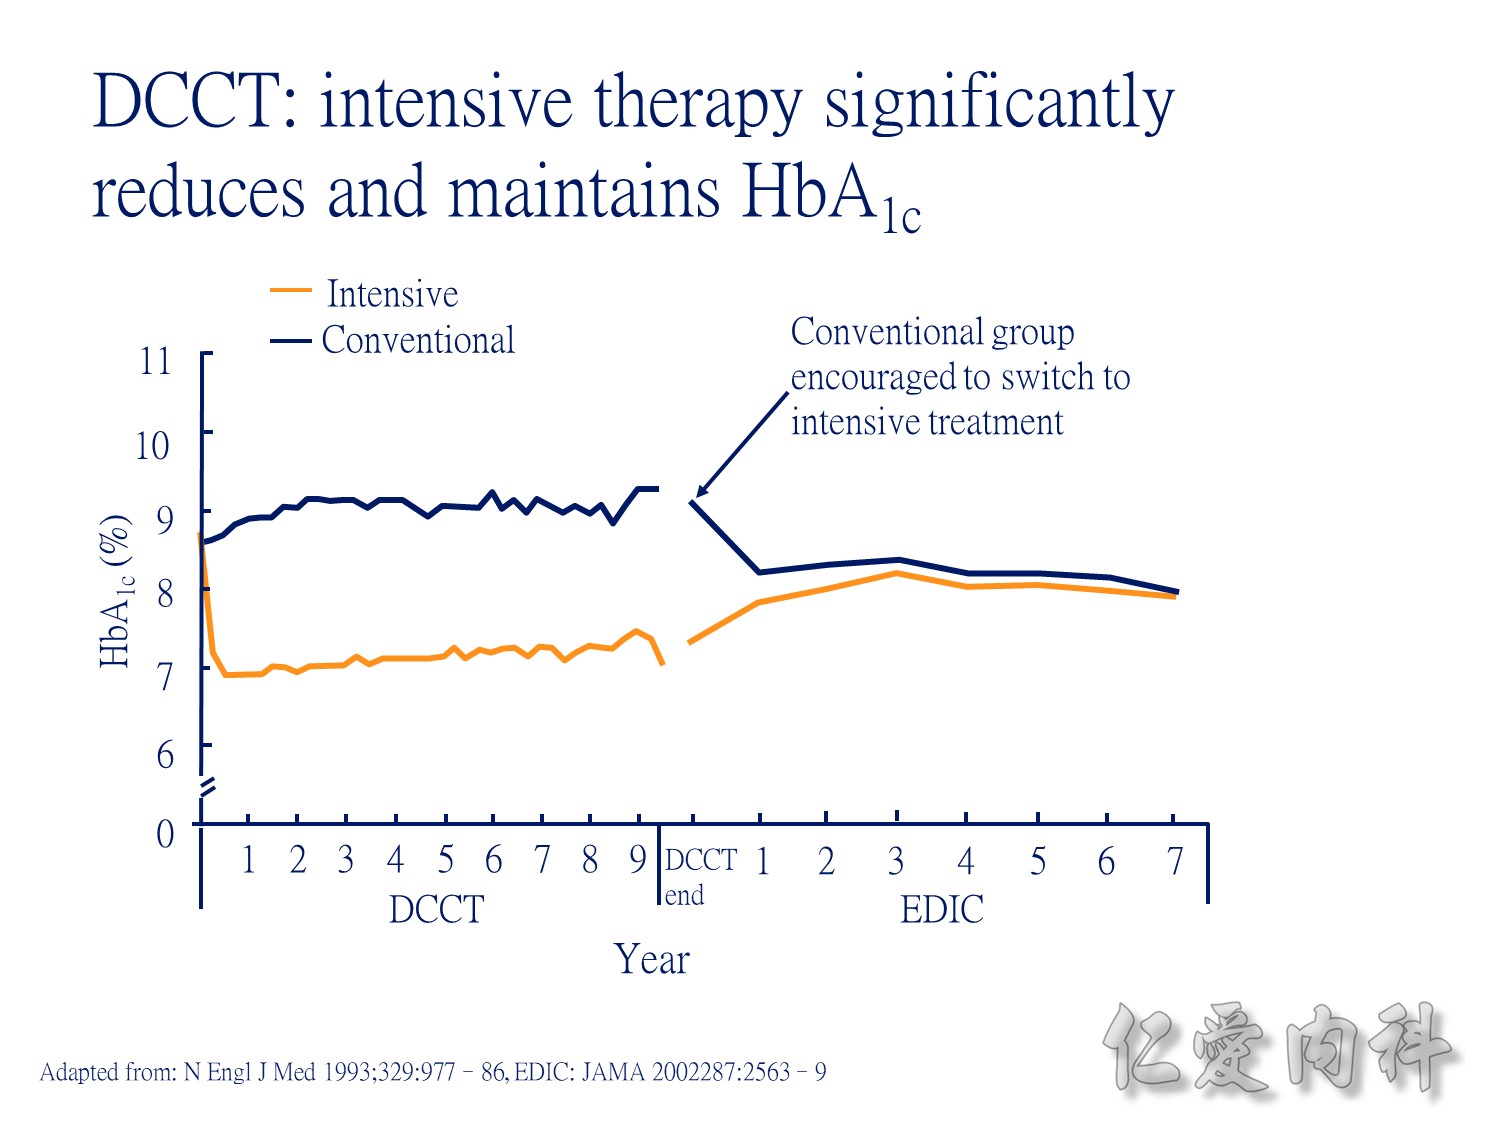
During DCCT, intensive insulin therapy in people with type 1 diabetes significantly reduced HbA1c relative to those receiving conventional treatment. The intensively-treated group achieved a mean HbA1c of 7.1%, while the conventionally-treated patients had HbA1c of approximately 9.0%. During the EDIC (Epidemiology of Diabetes Intervention and Complications research group) follow-up of the DCCT cohort, all patients were encouraged to adopt intensive insulin therapy. During this time, HbA1c stablised to a similar level (just over 8%) in both treatment groups.
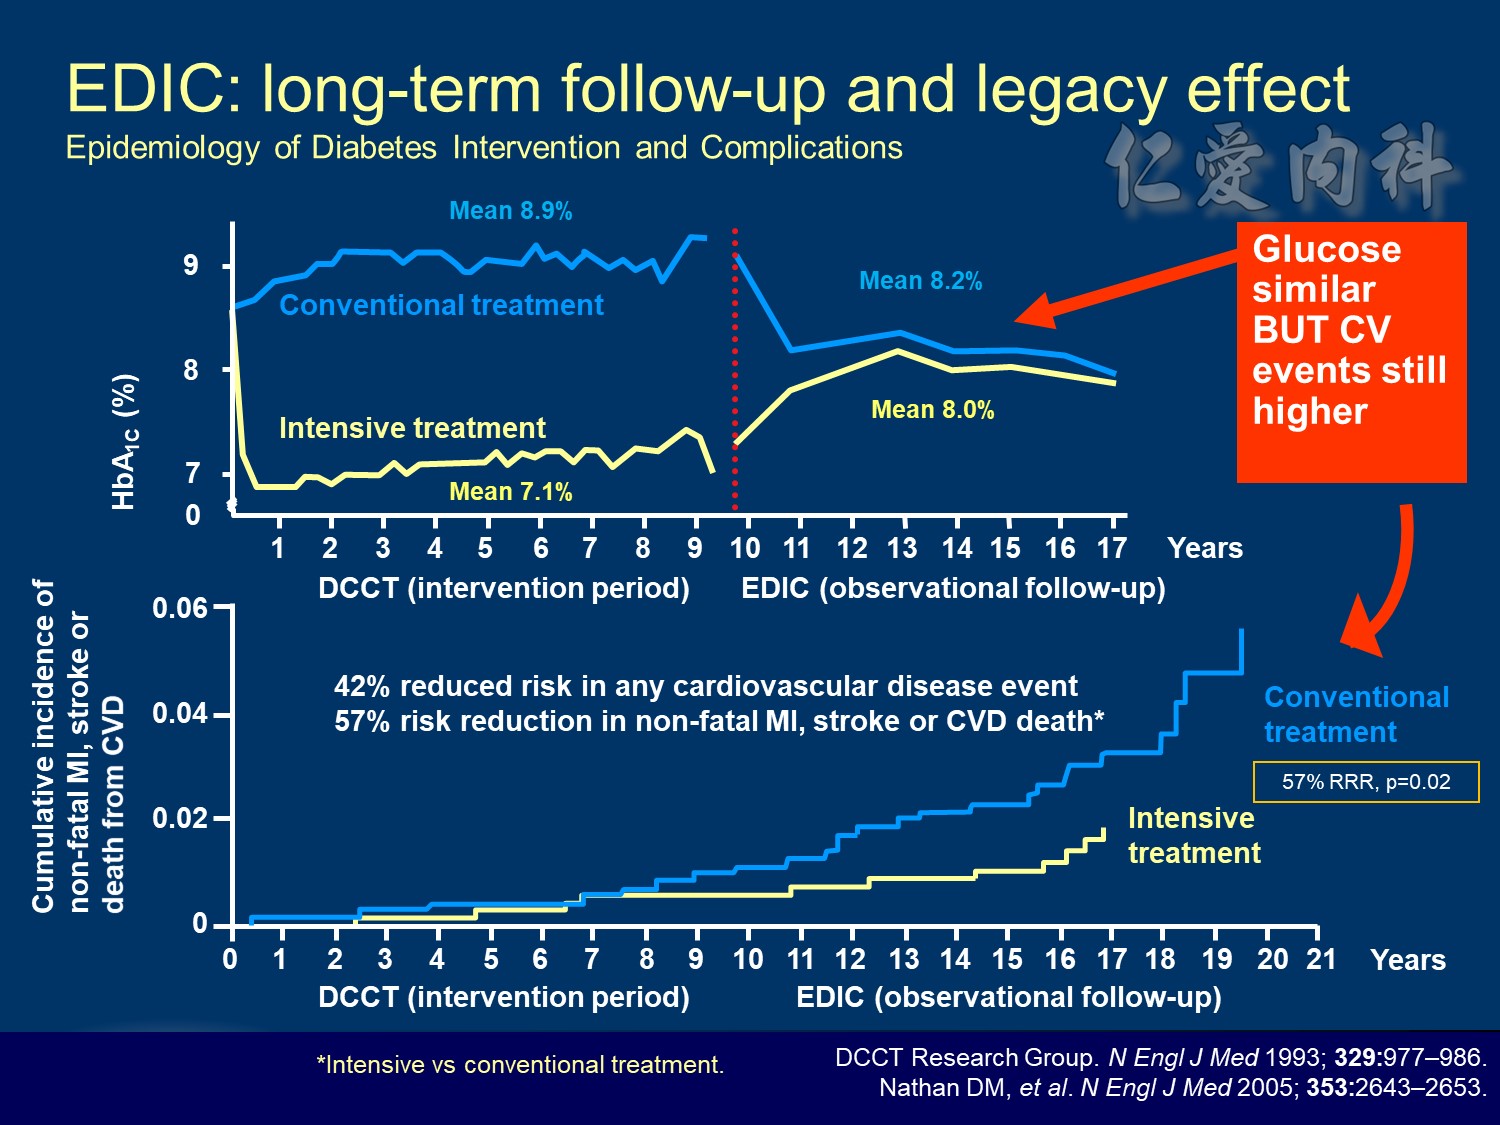

10 yrs EDIC HbA1C conrol <7% à legacy effect


Conclusion:
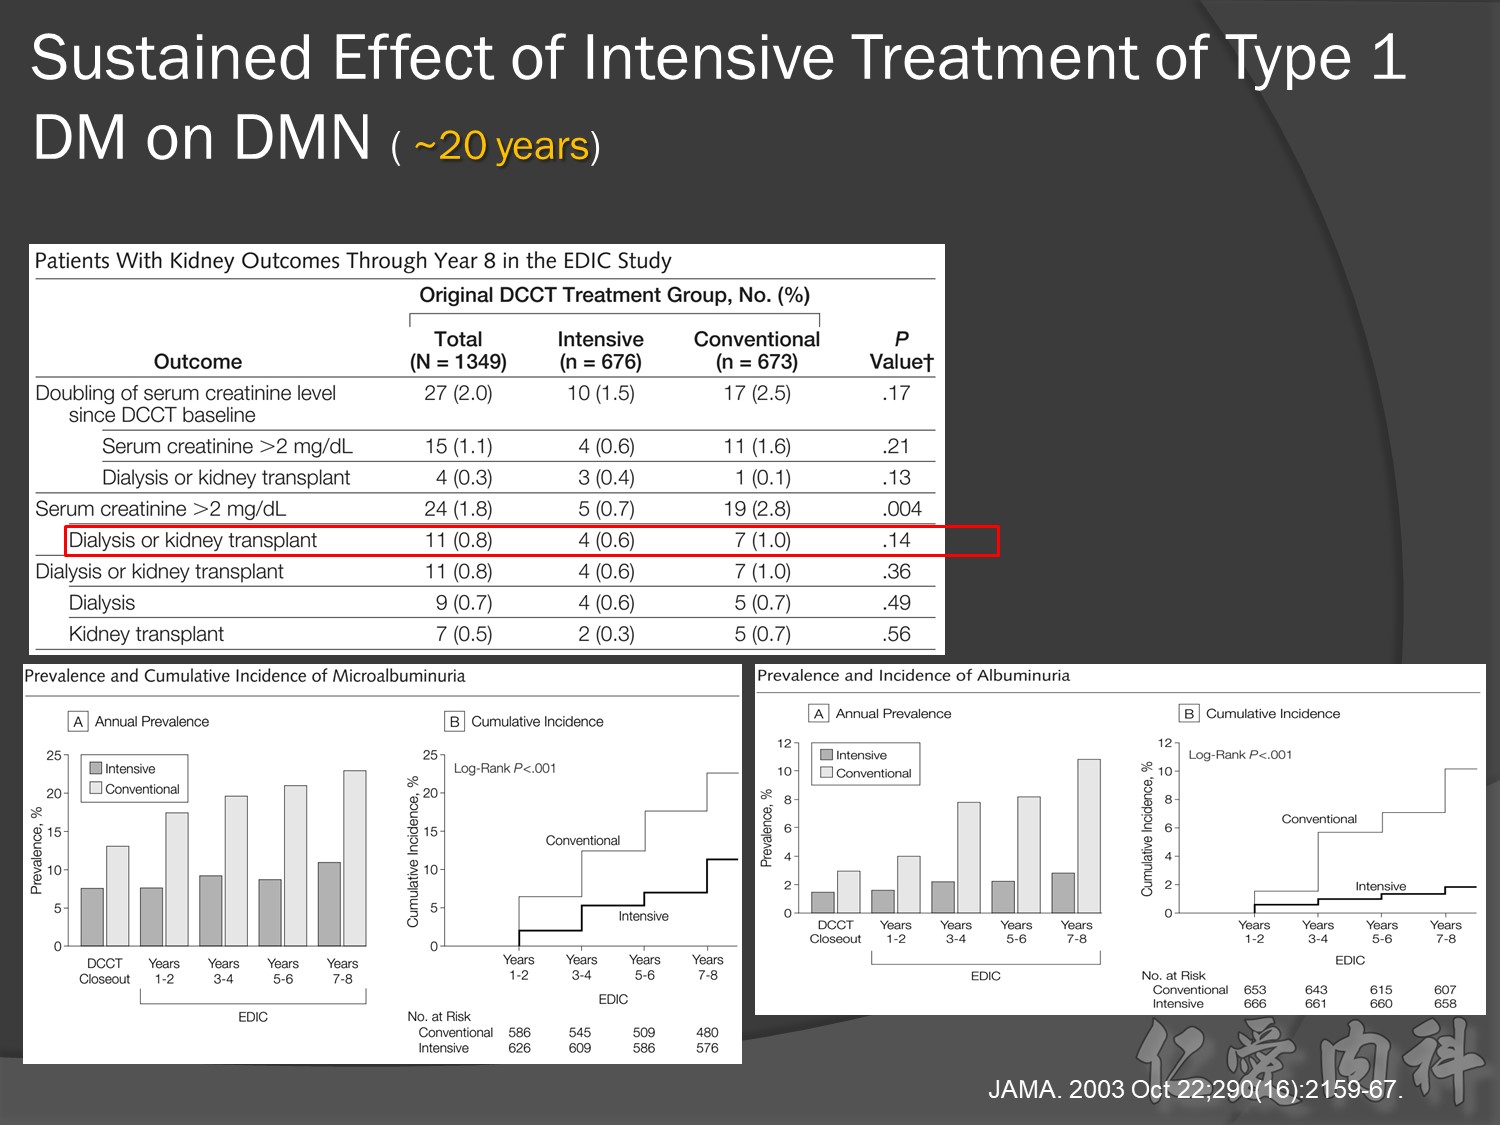
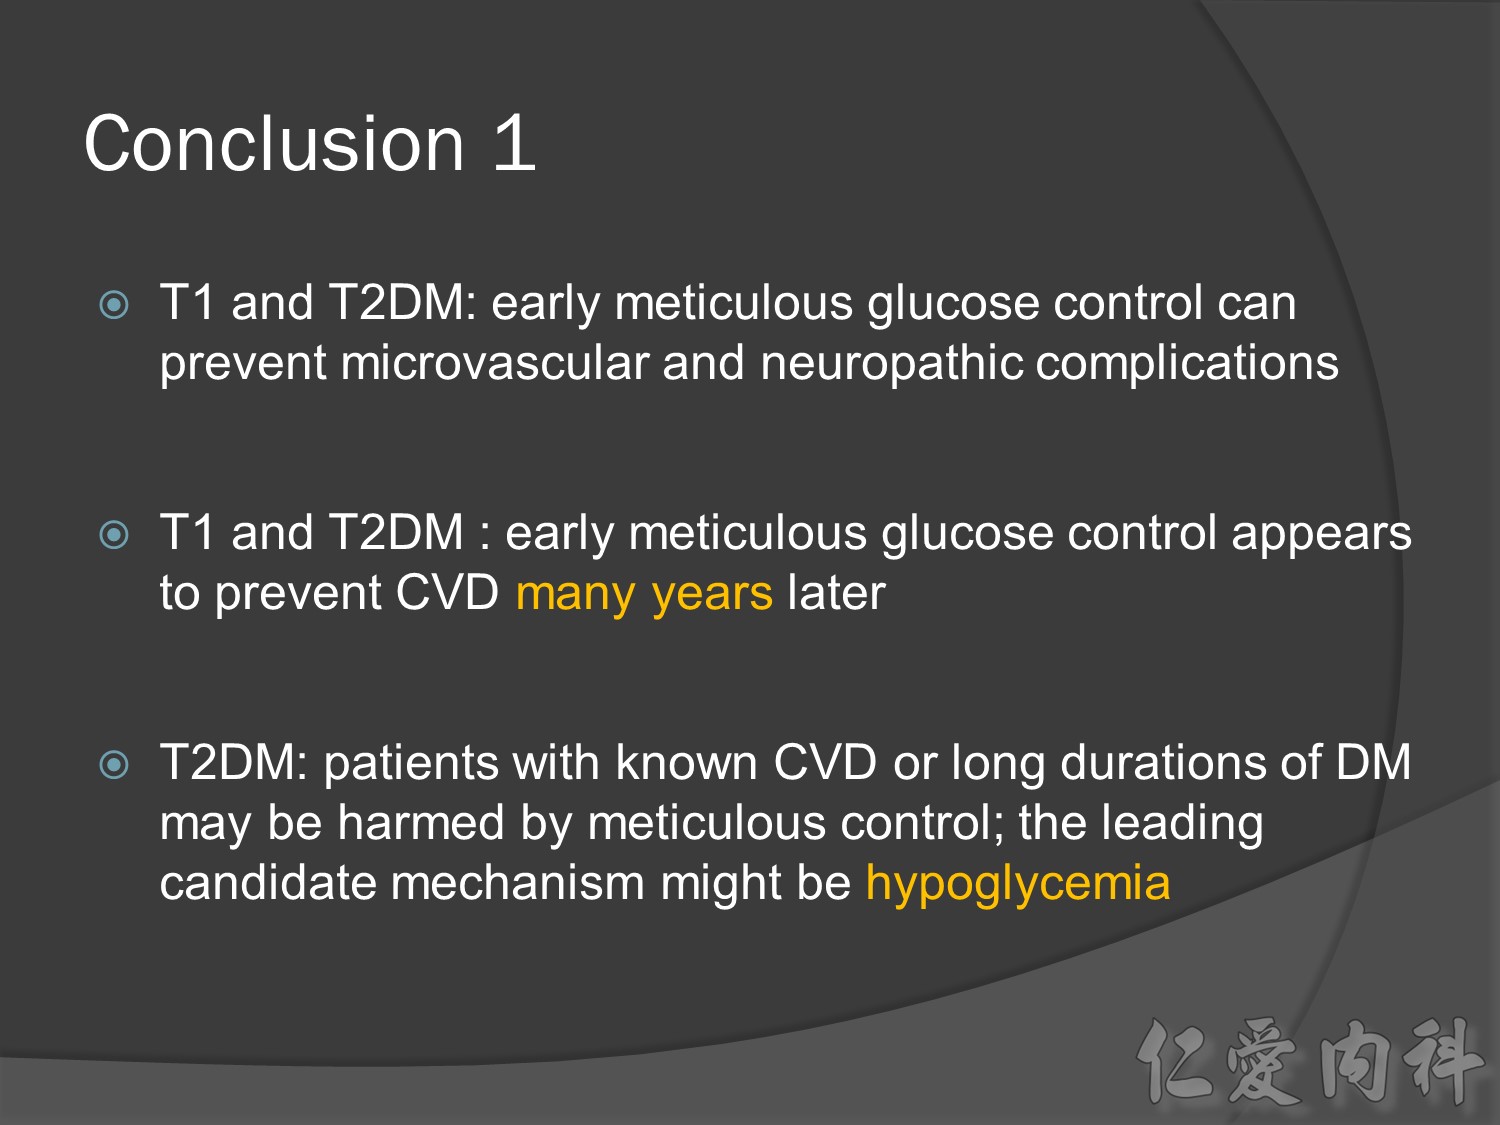
前幾年microvascular events à會改變à改善
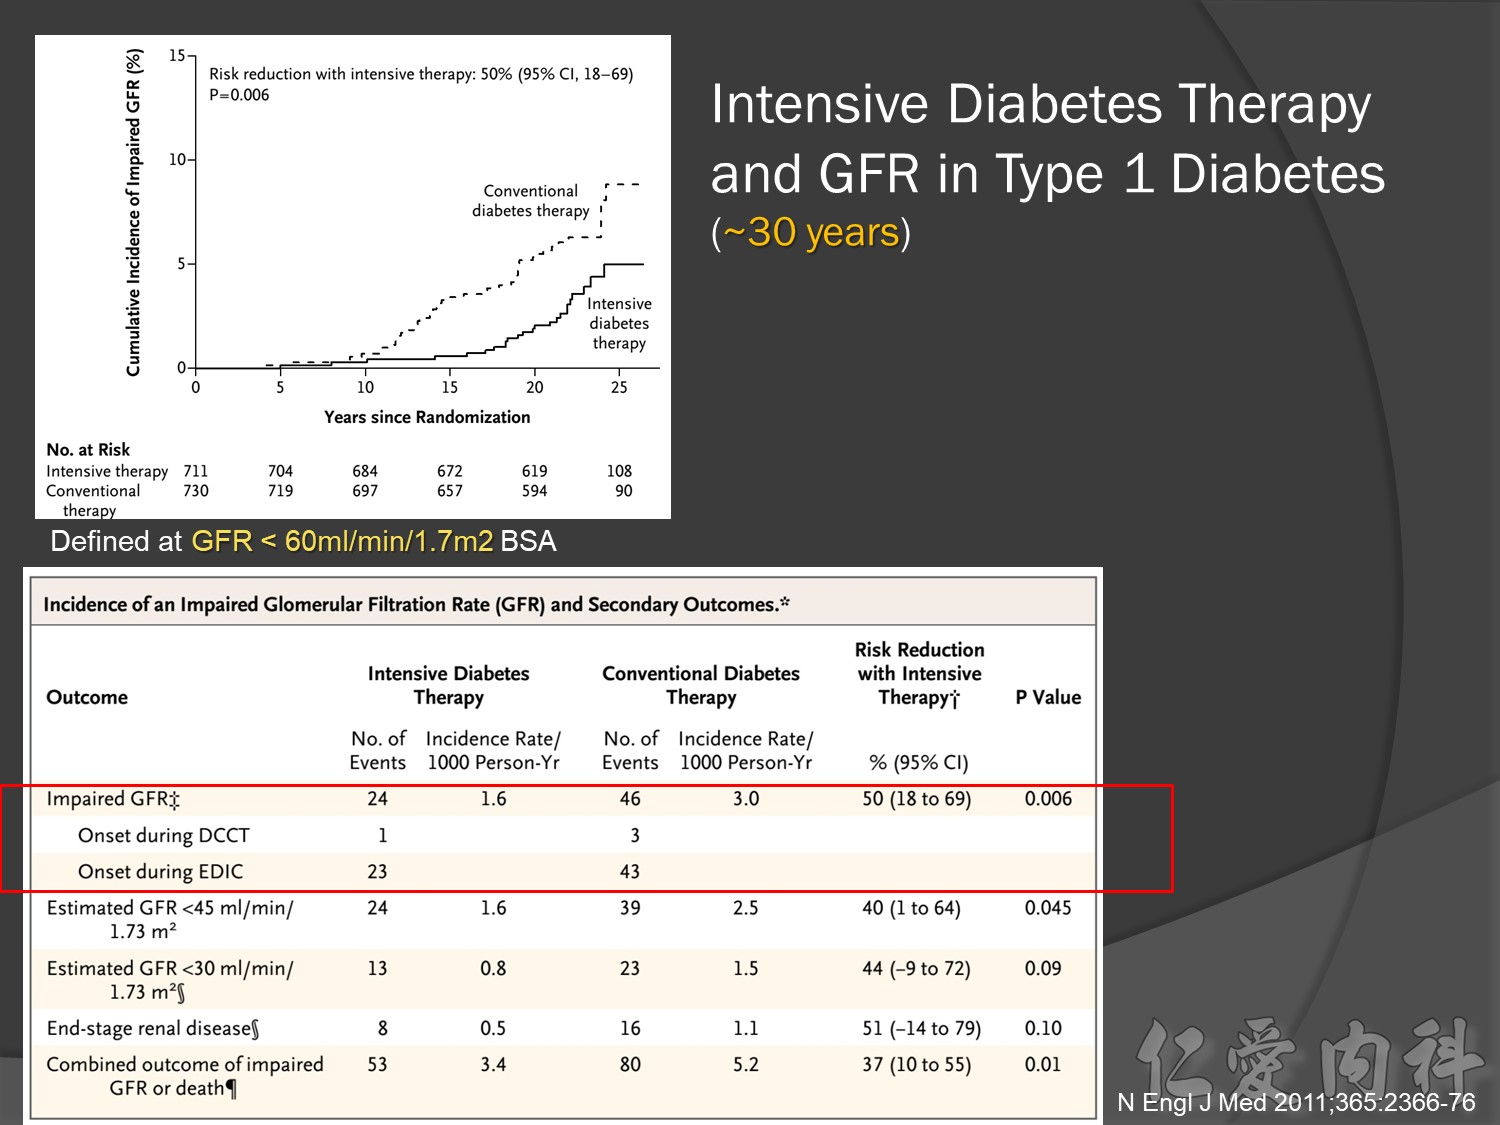
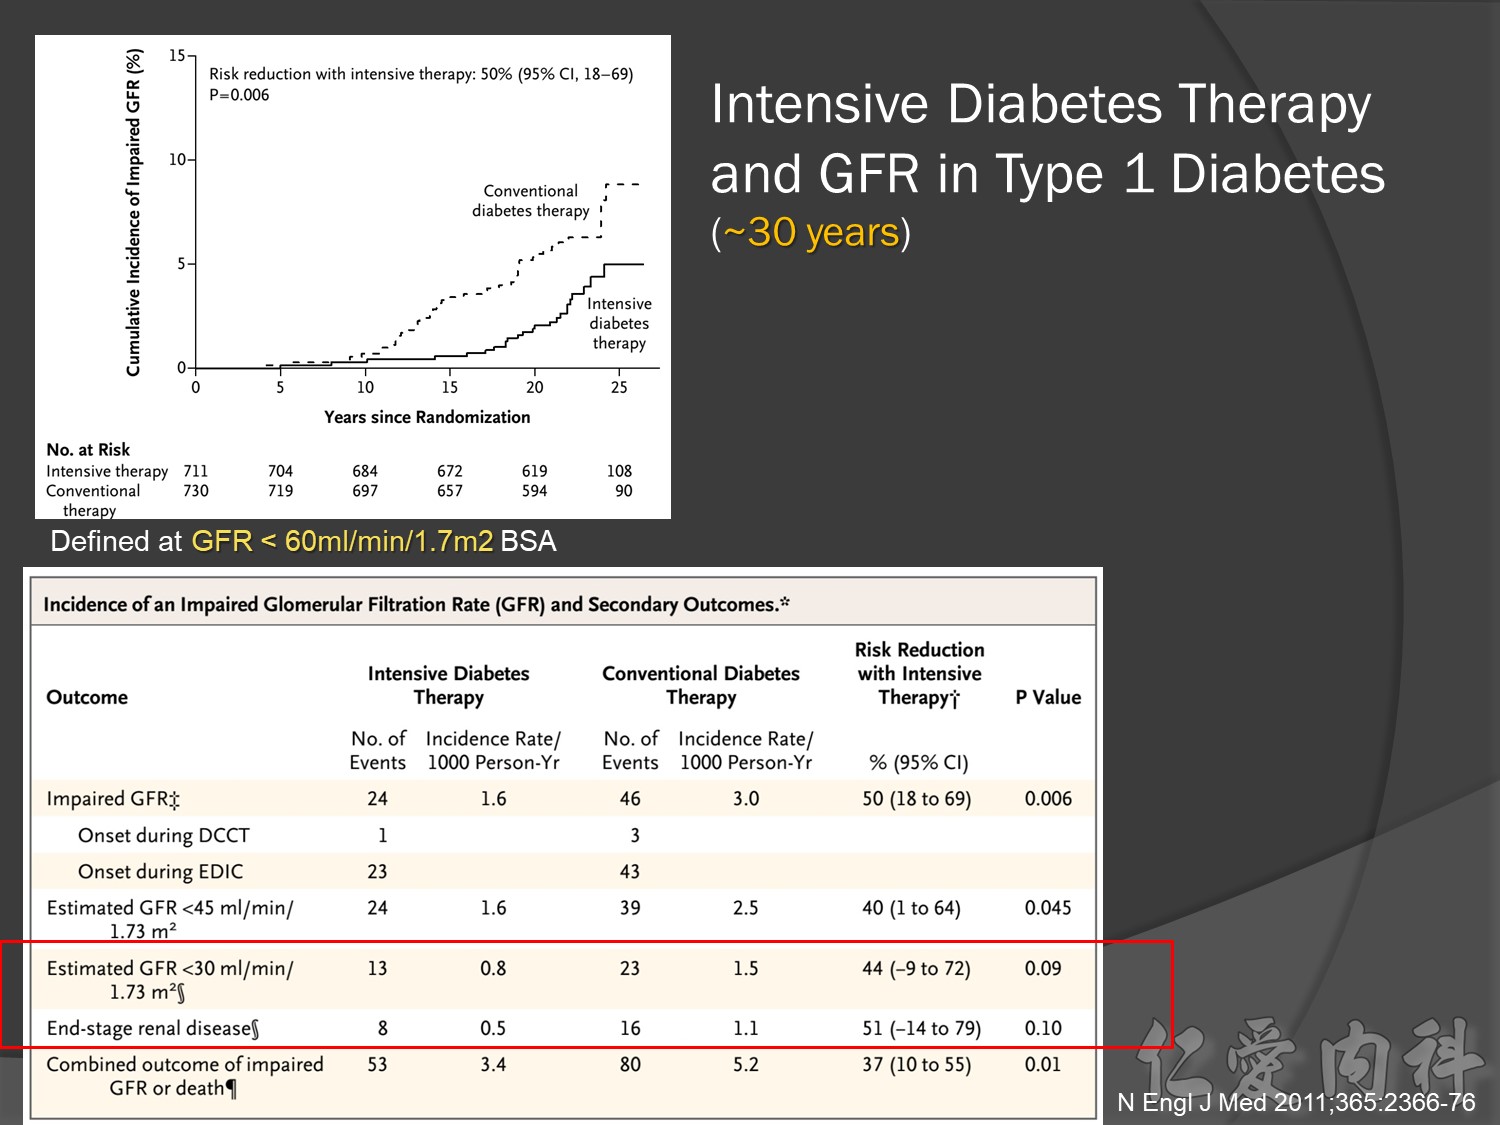
幾年後10-20-30後macrovascular events outcomes à 才會改變à改善
30年後GFR可改善60%,對洗腎的需求會有差


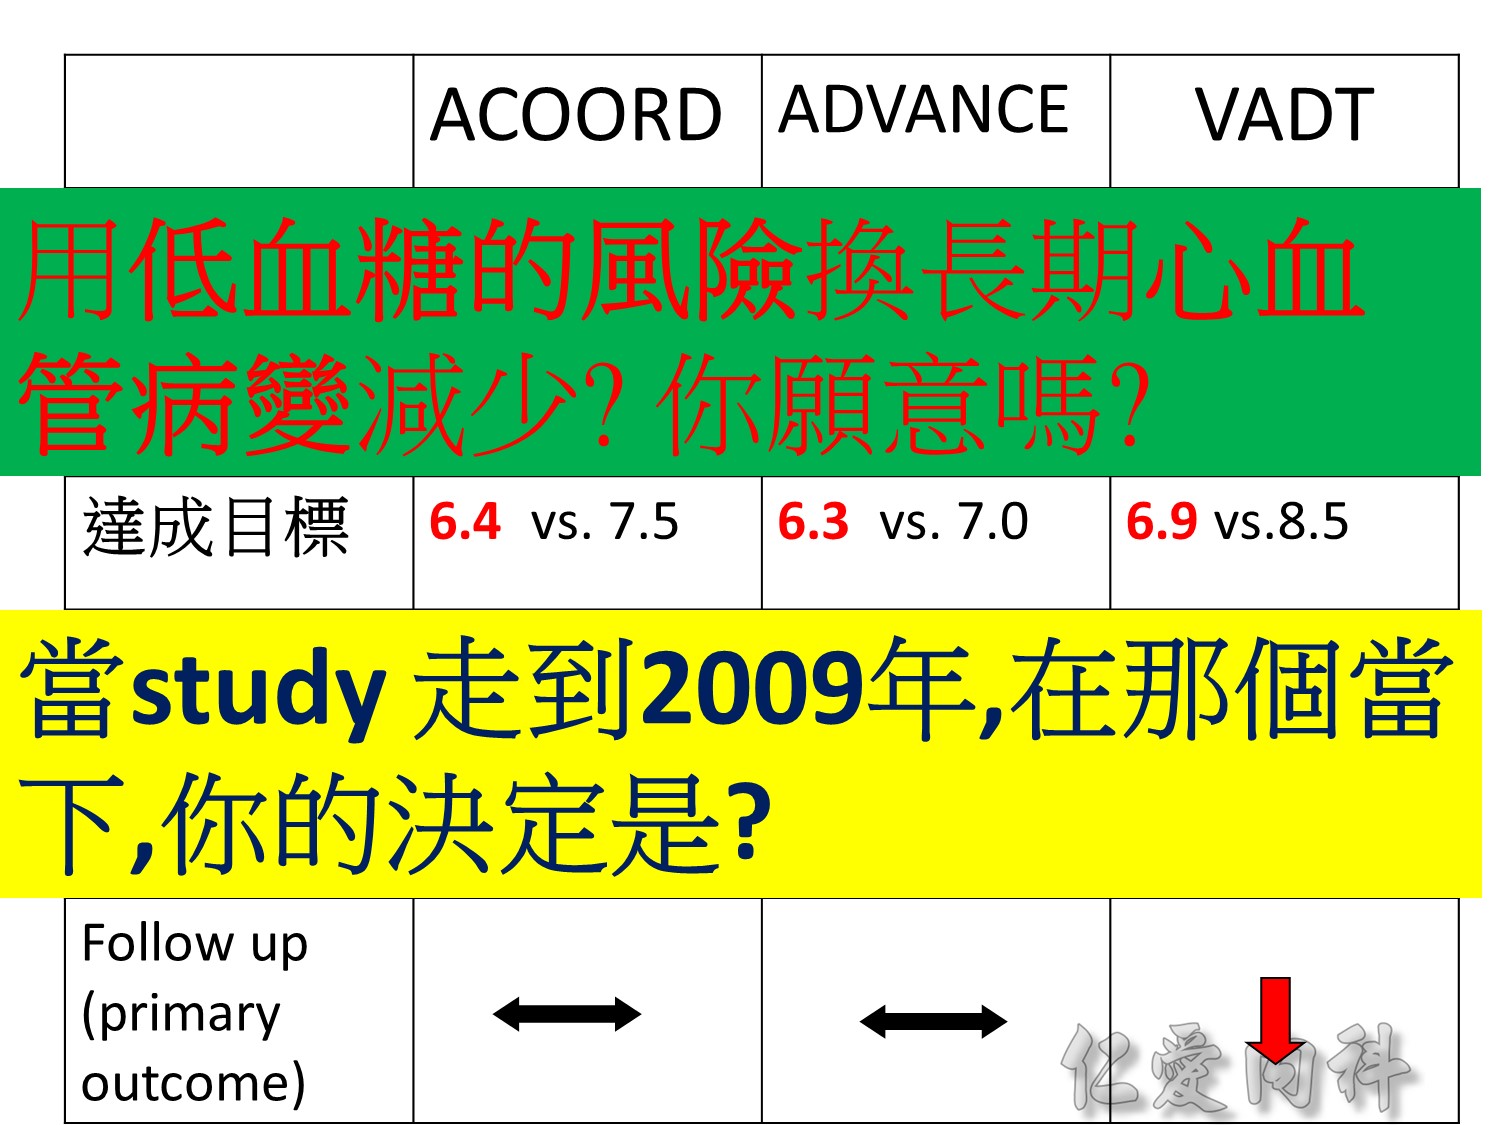
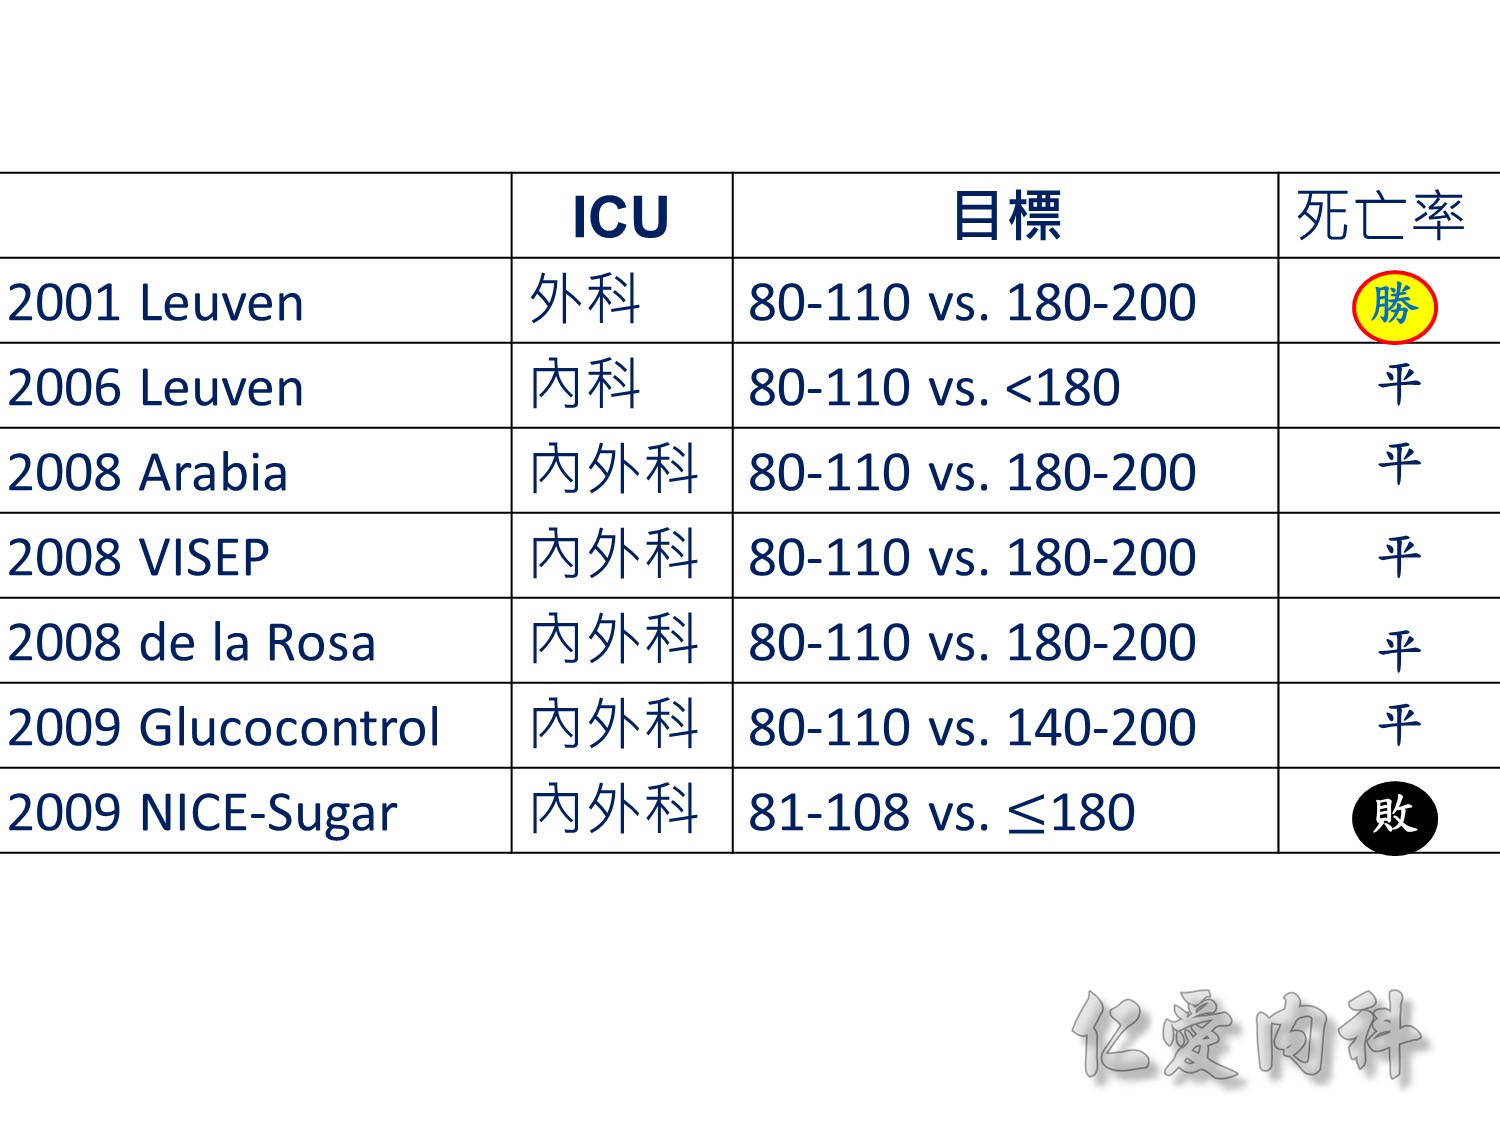
當study 走到2009年,在那個當下,你的決定是?

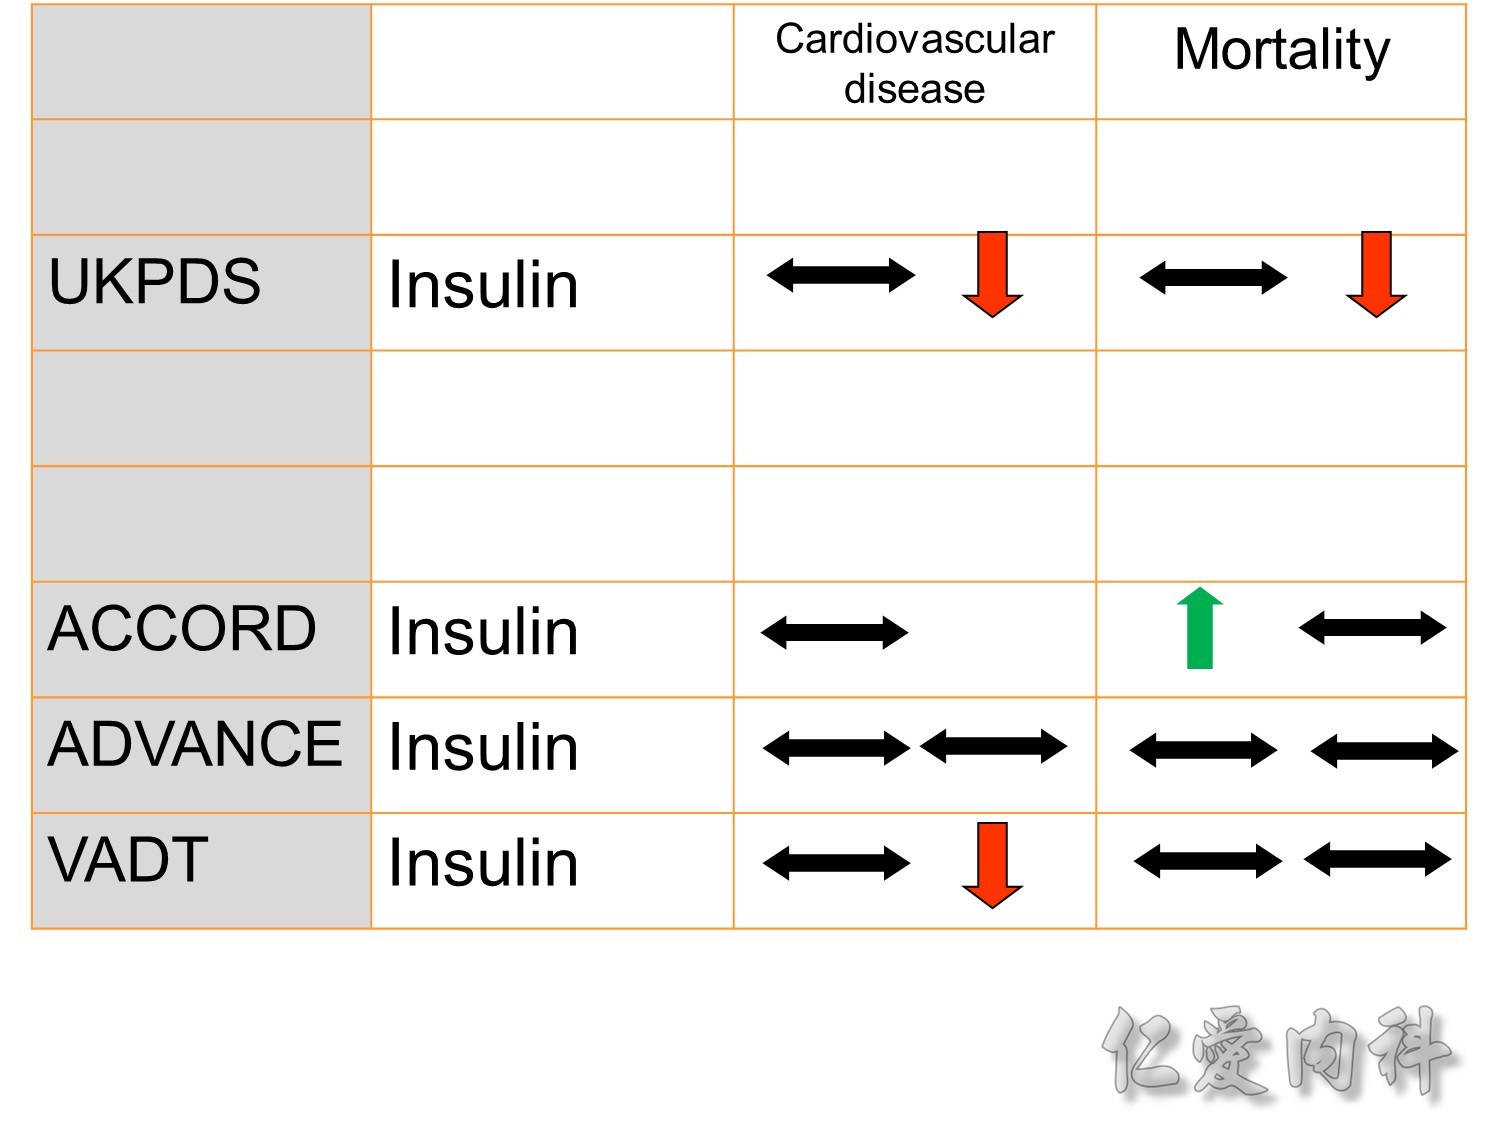
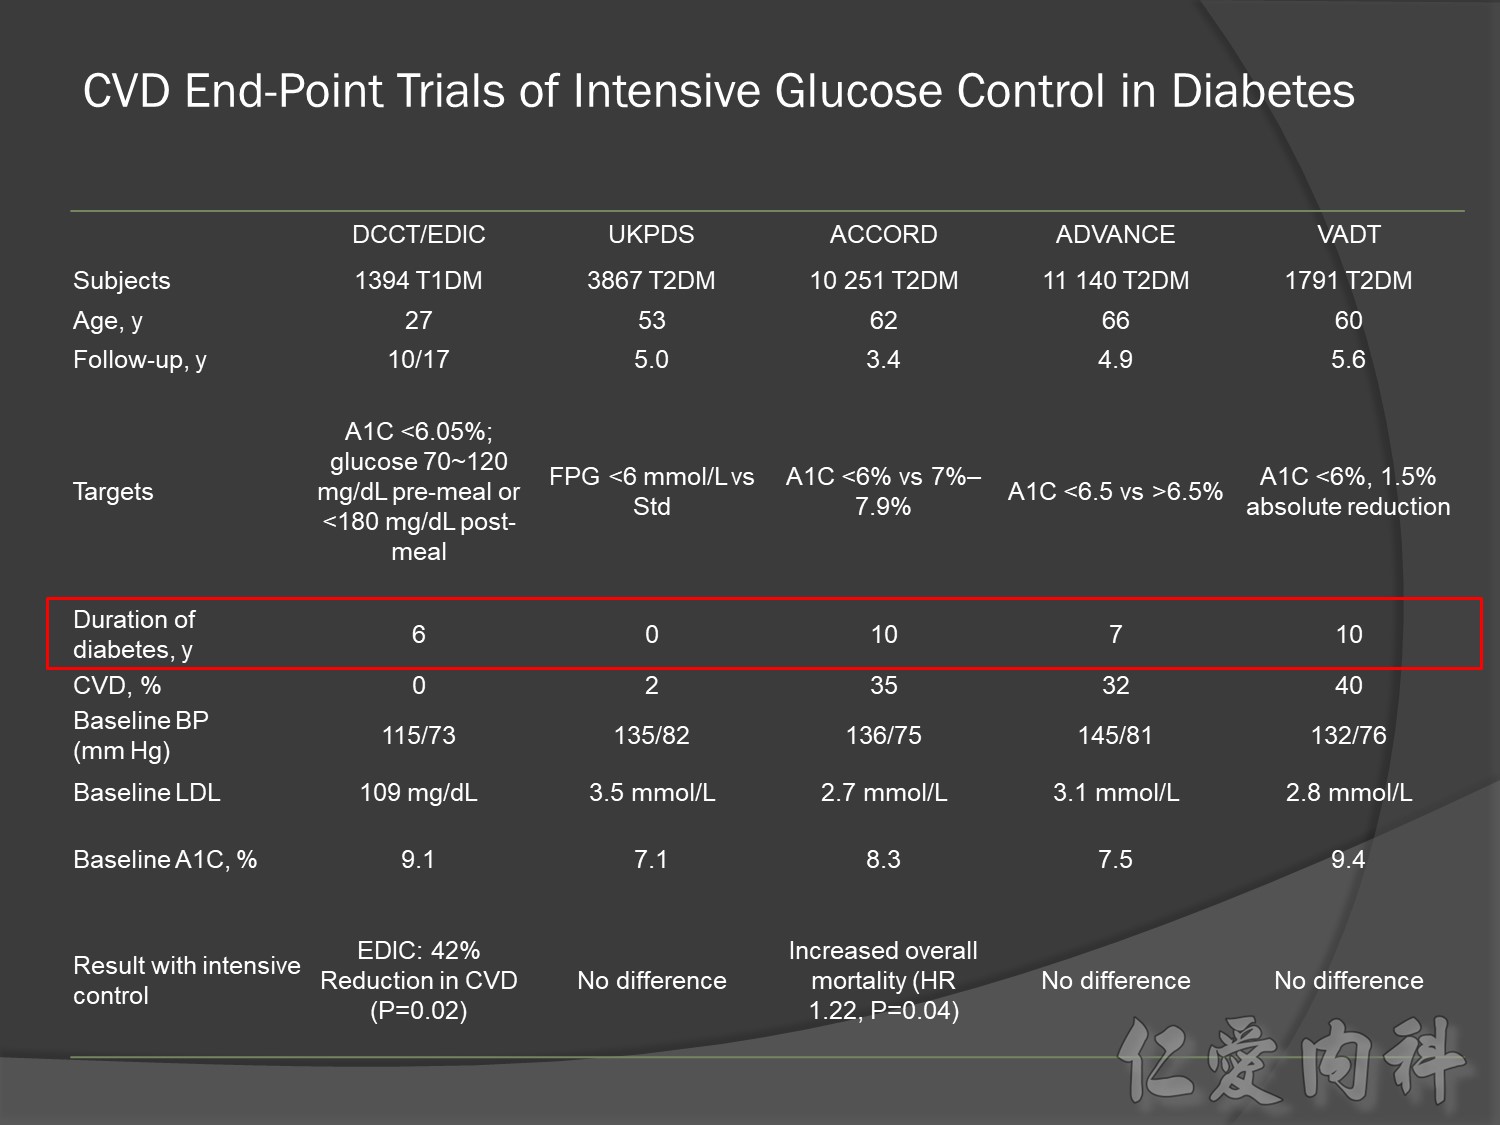
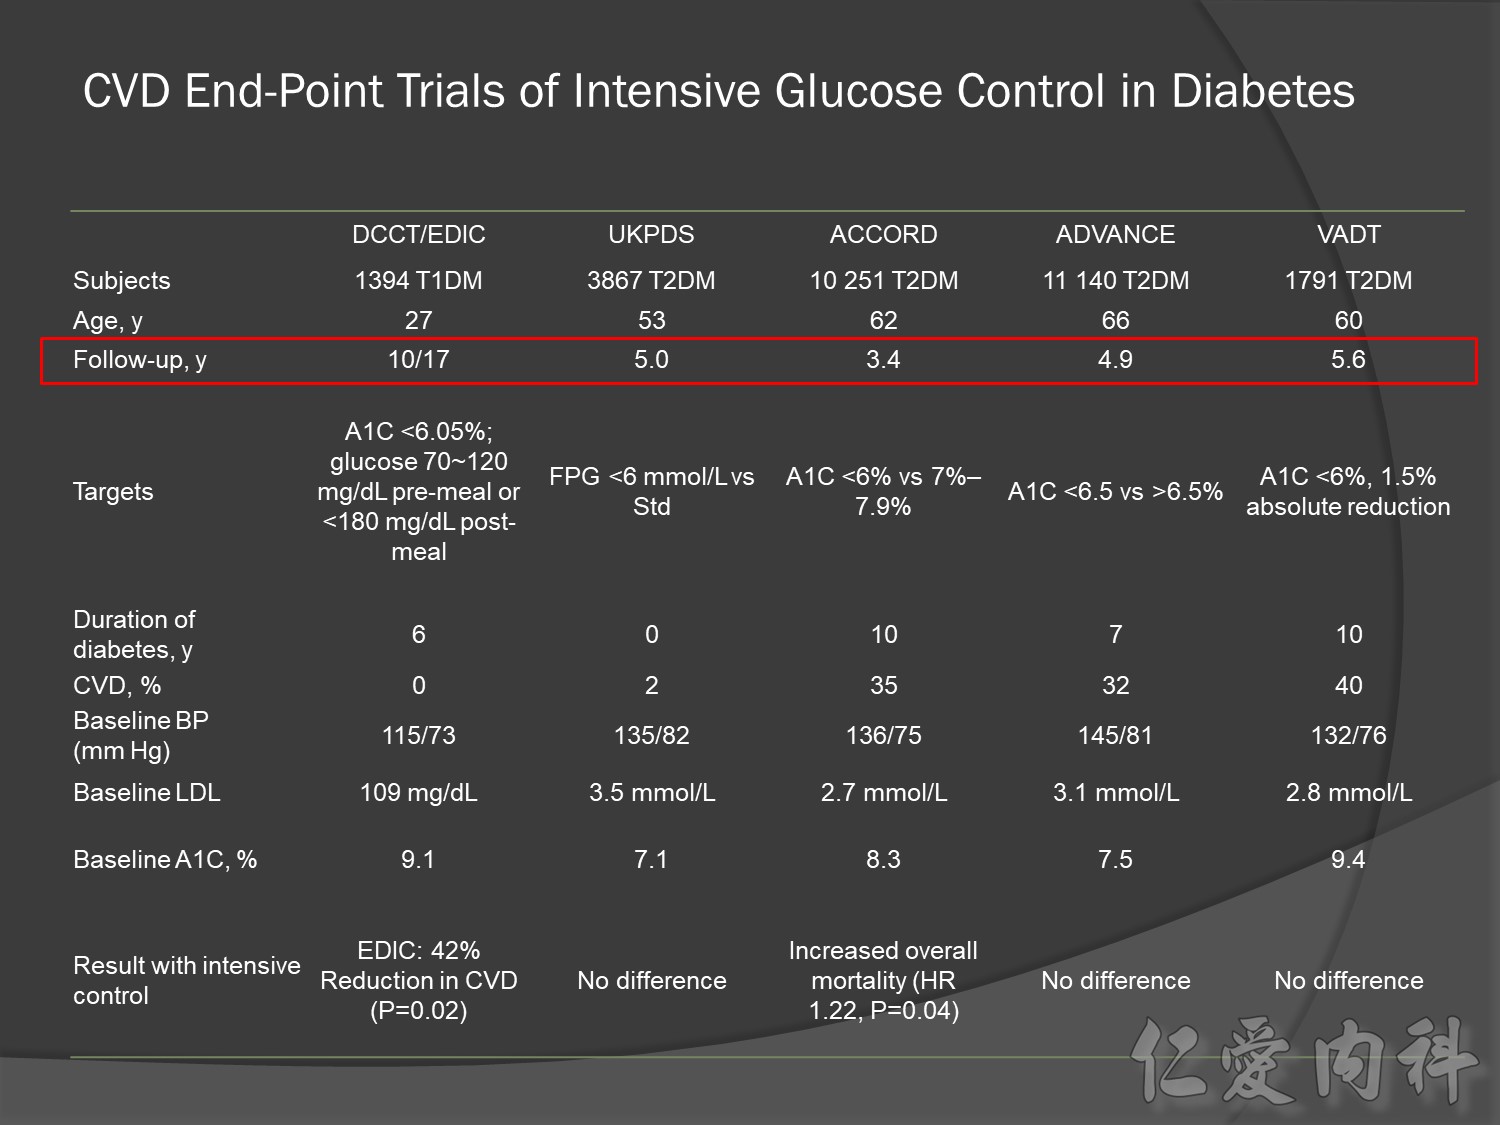
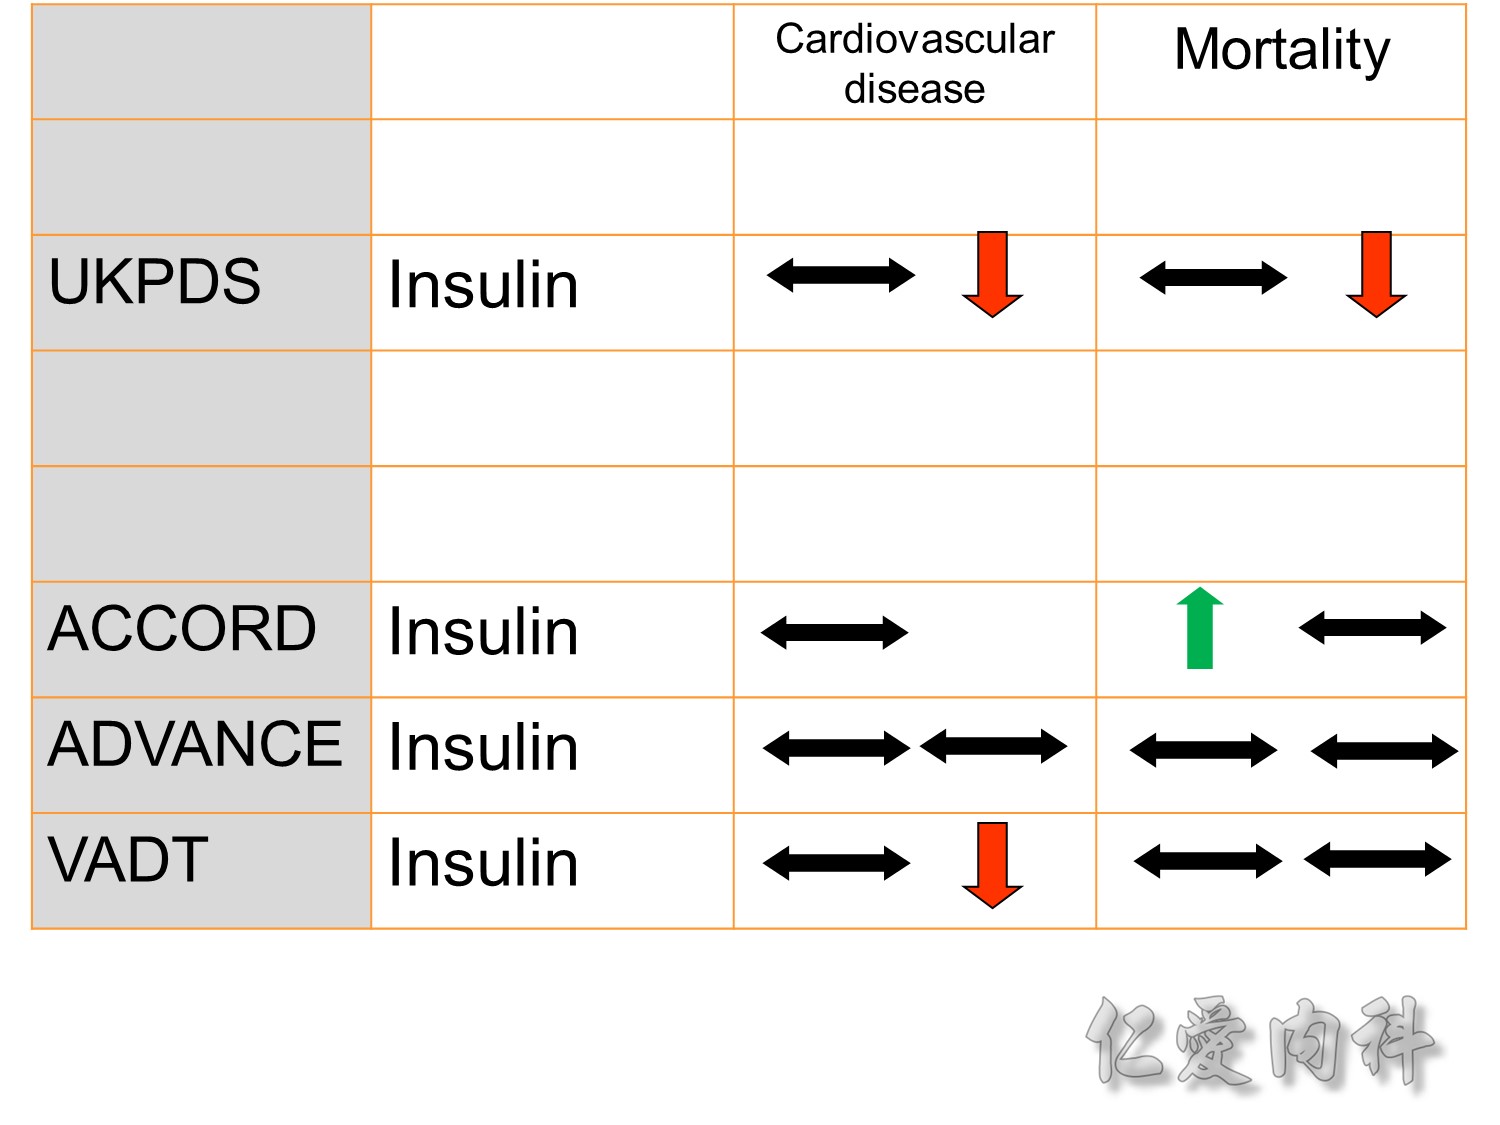
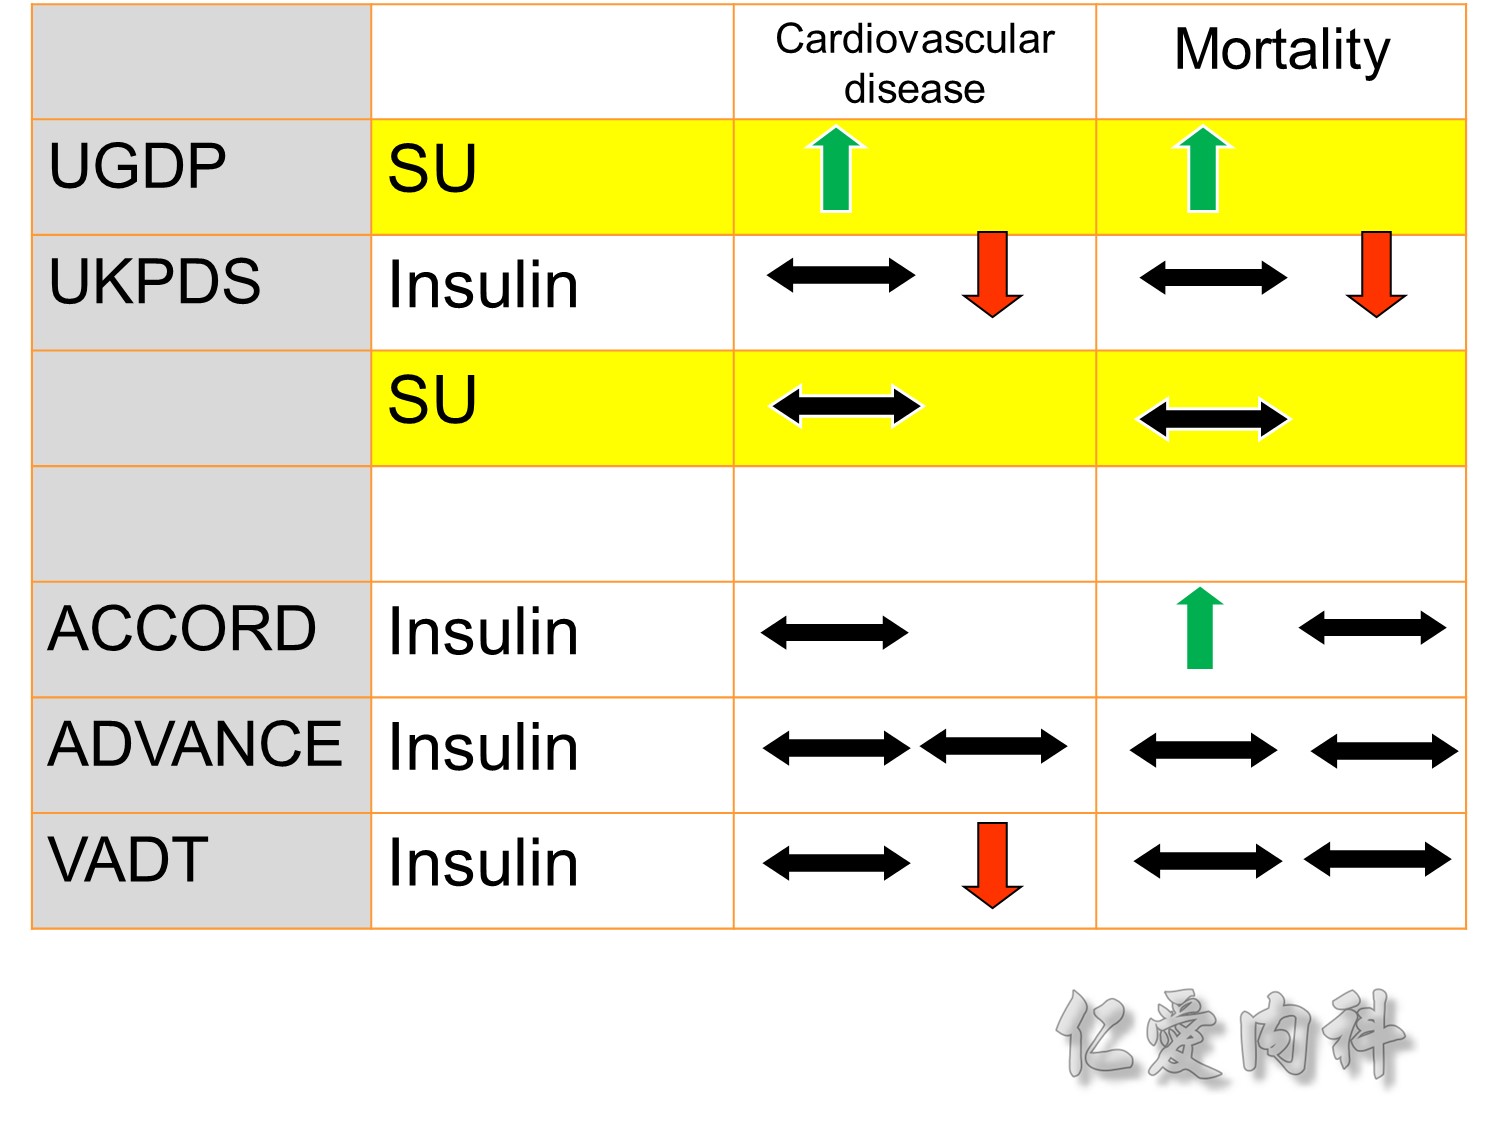
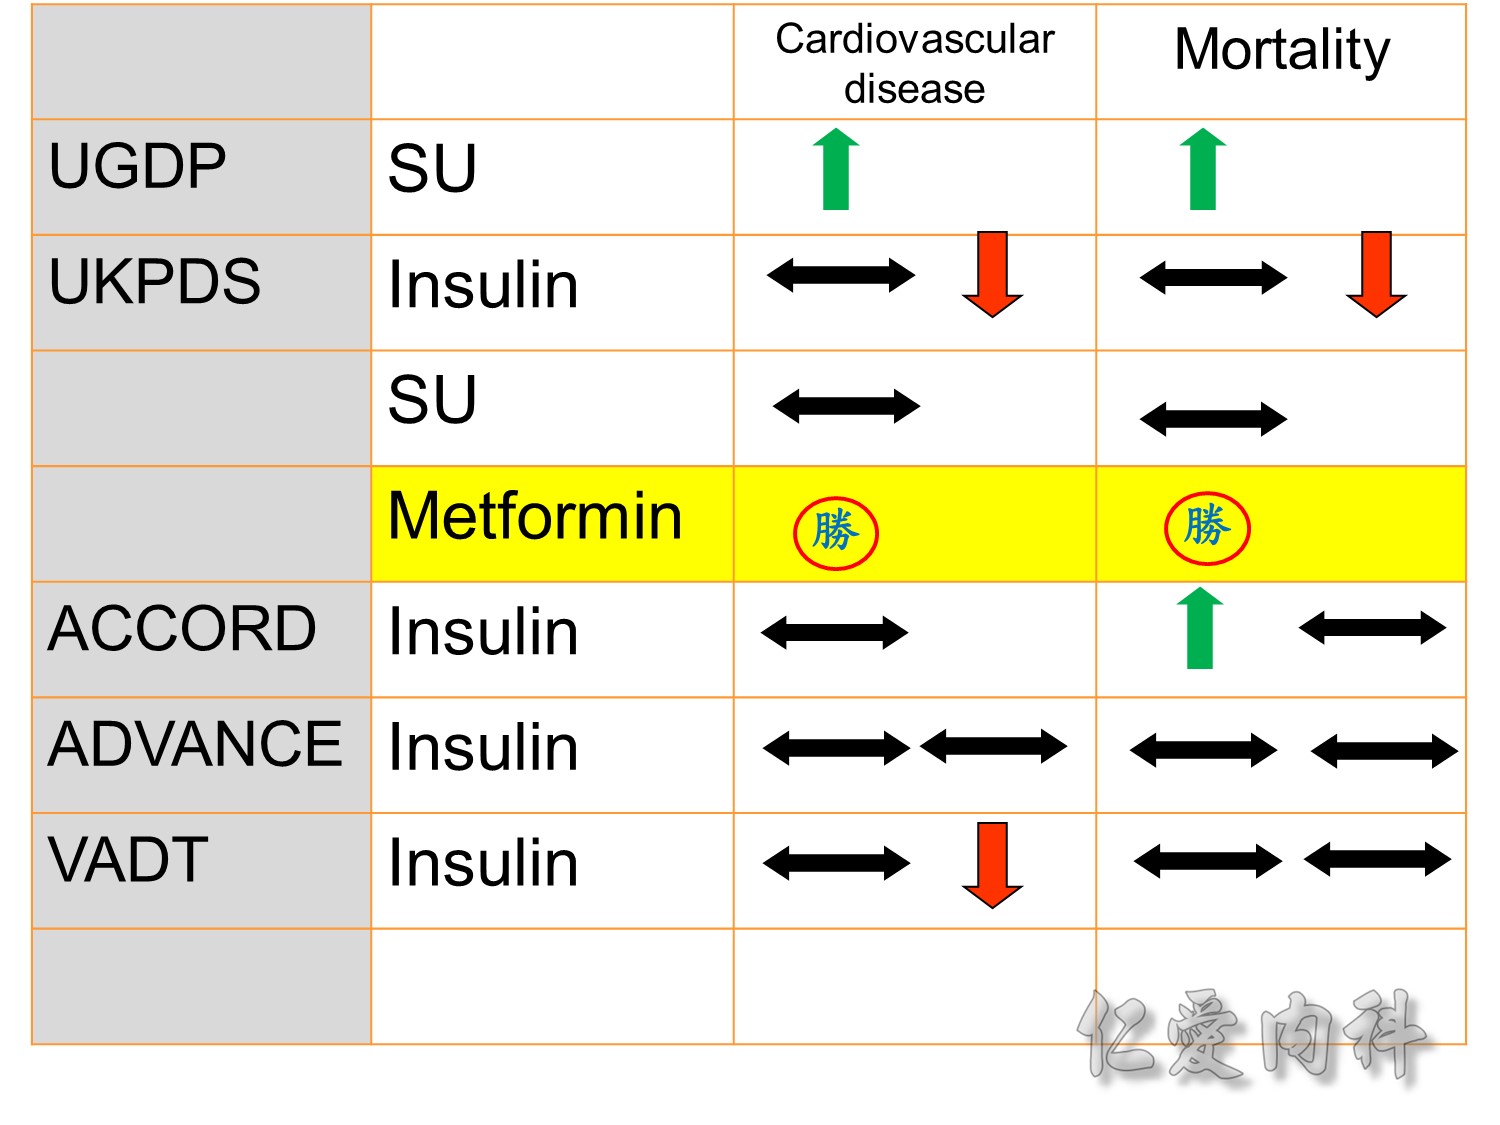
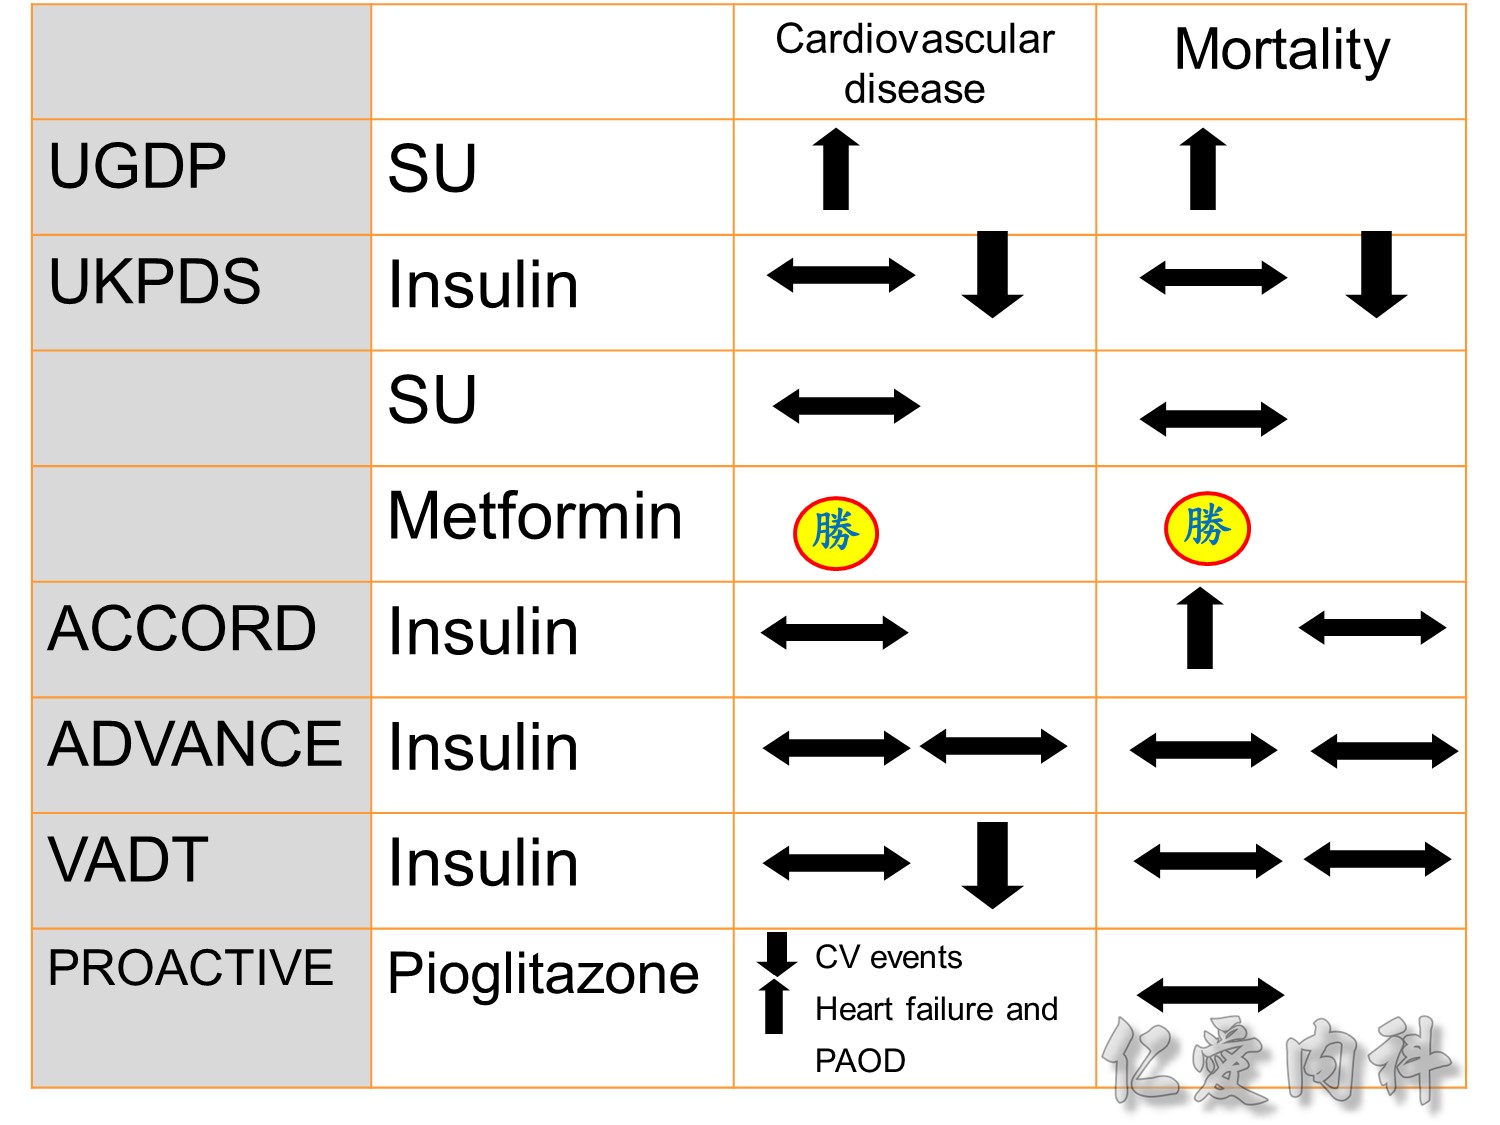
The DCCT (Diabetes Control and Complications Trial) showed that intensive treatment reduced the risks of retinopathy, nephropathy, and neuropathy by 35% to 90% compared with conventional treatment.1 These risk reductions were maintained through 7 years of follow-up in EDIC (Epidemiology of Diabetes Interventions and Complications).1 Risk reductions emerged for any cardiovascular (CV) disease event (p=0.02) in EDIC for patients who had received intensive treatment in DCCT.2 Mortality did not differ between the groups and was less than expected on the basis of population-based mortality studies.1
In the UKPDS (United Kingdom Prospective Diabetes Study), relative reductions in risk associated with intensive glucose control persisted at 10 years for microvascular disease (p=0.001).3,4 Post-trial risk reductions emerged for myocardial infarction (p=0.014) and death from any cause (p=0.007).3,4
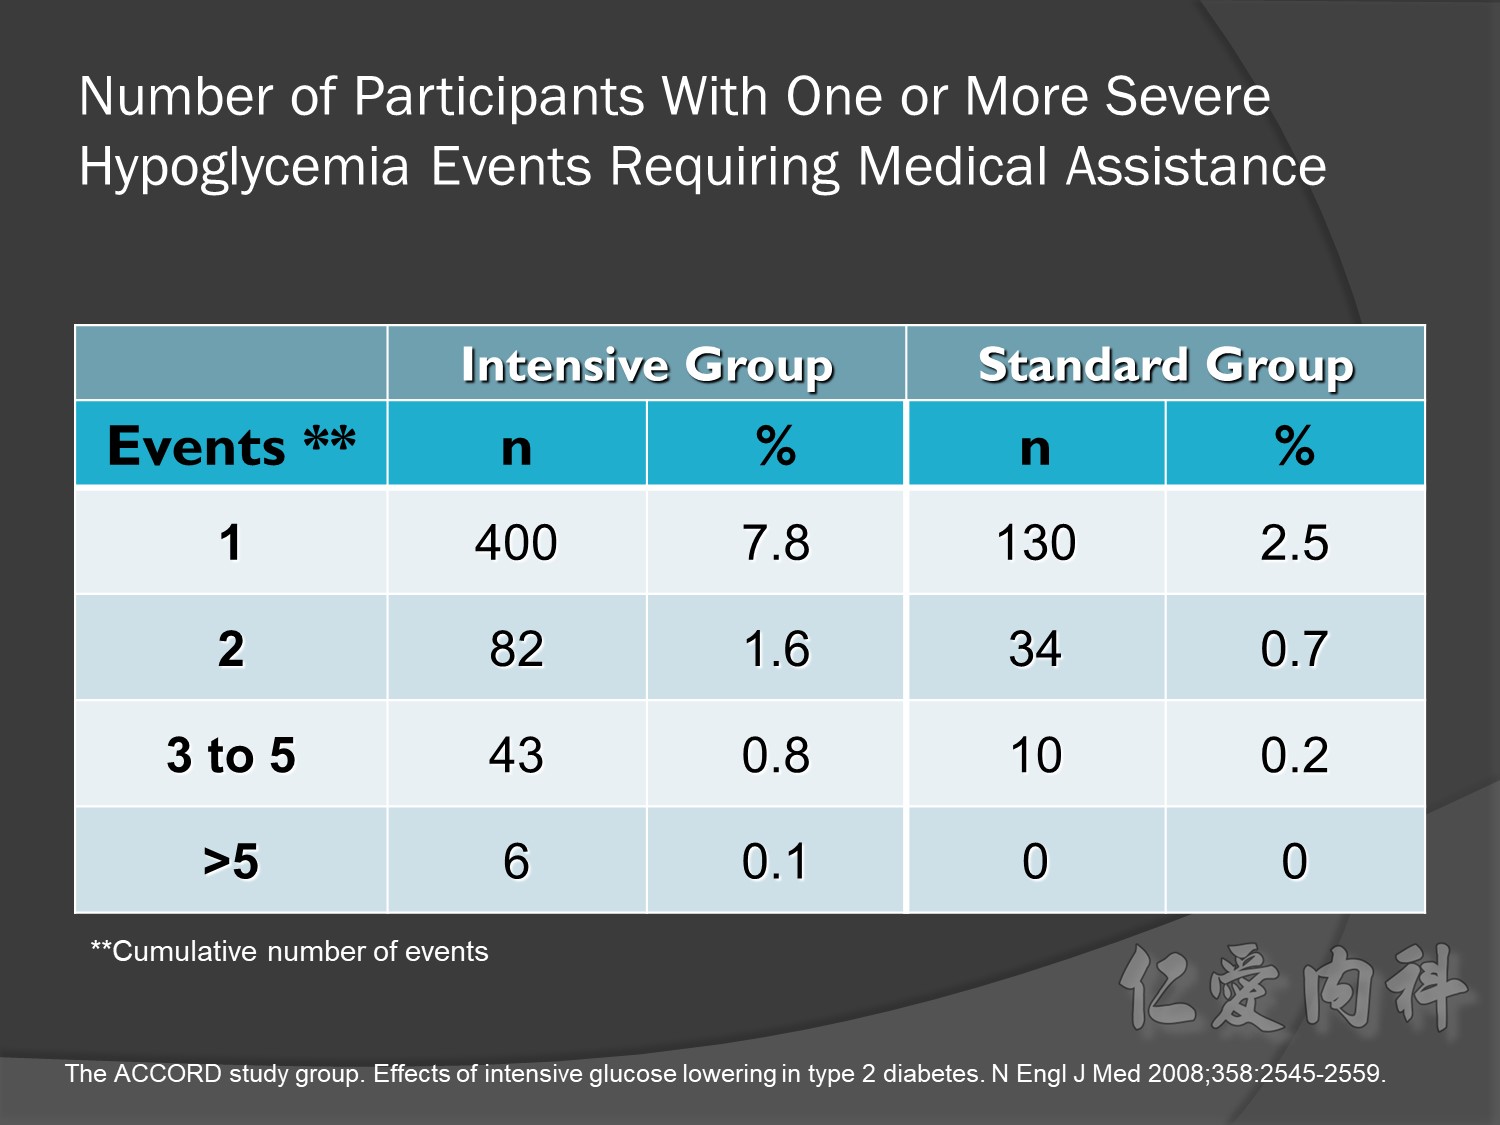
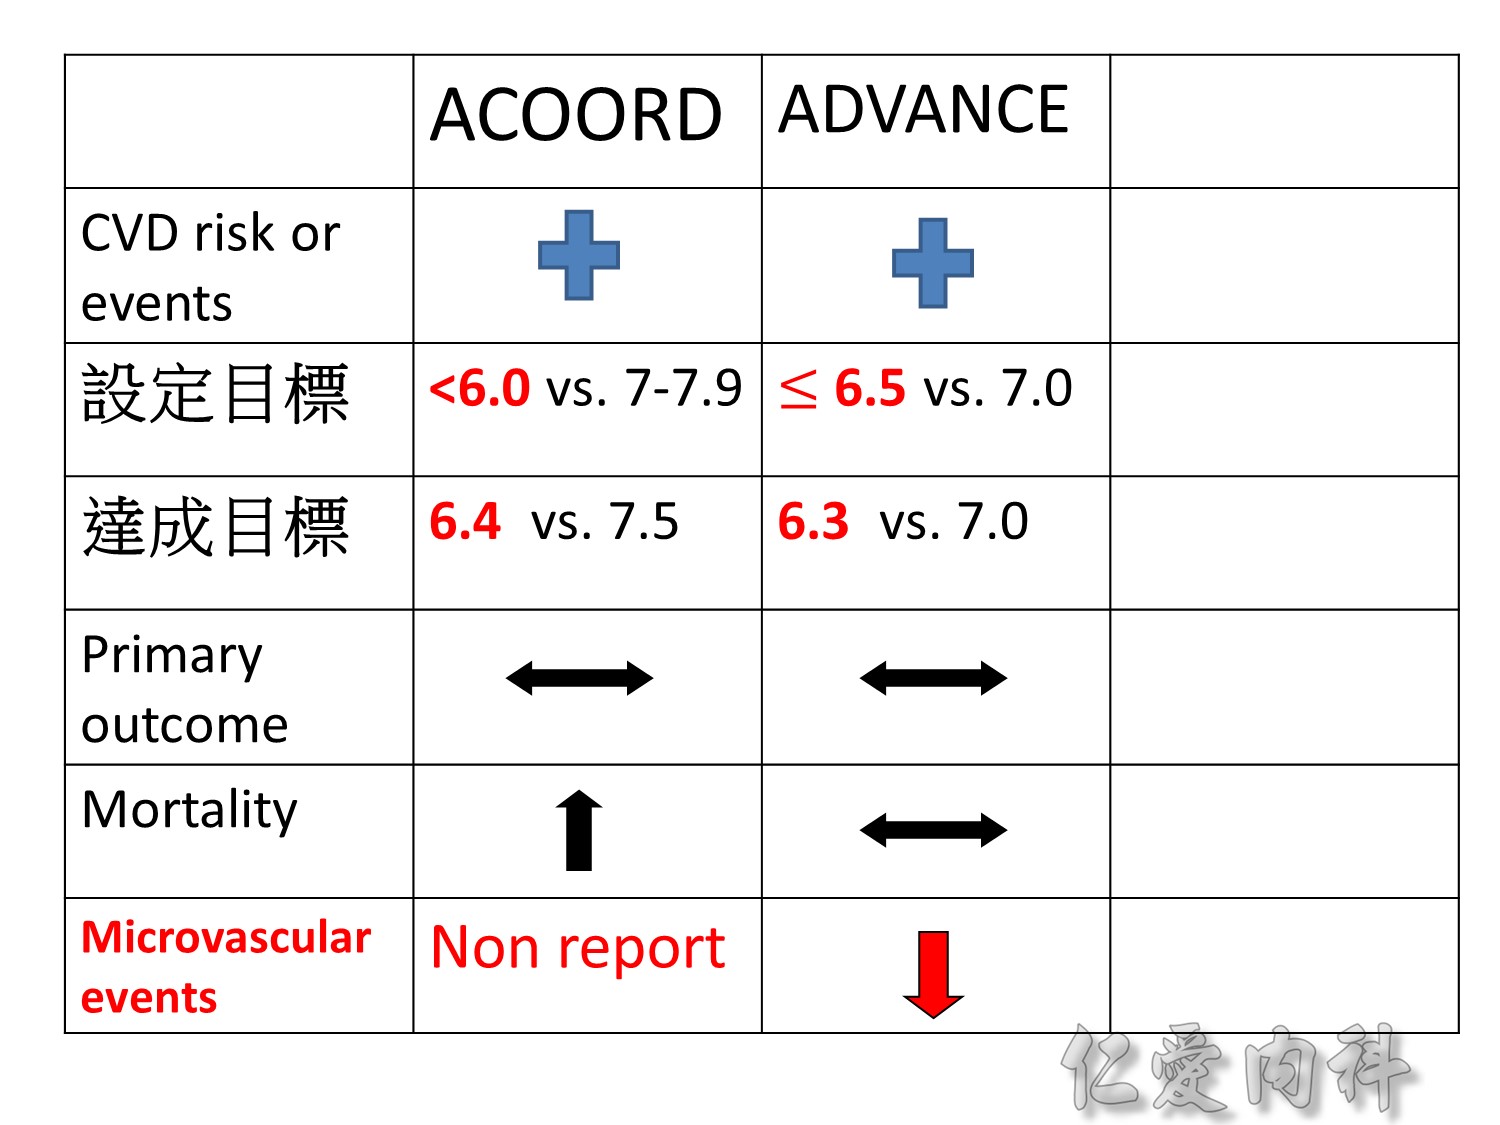
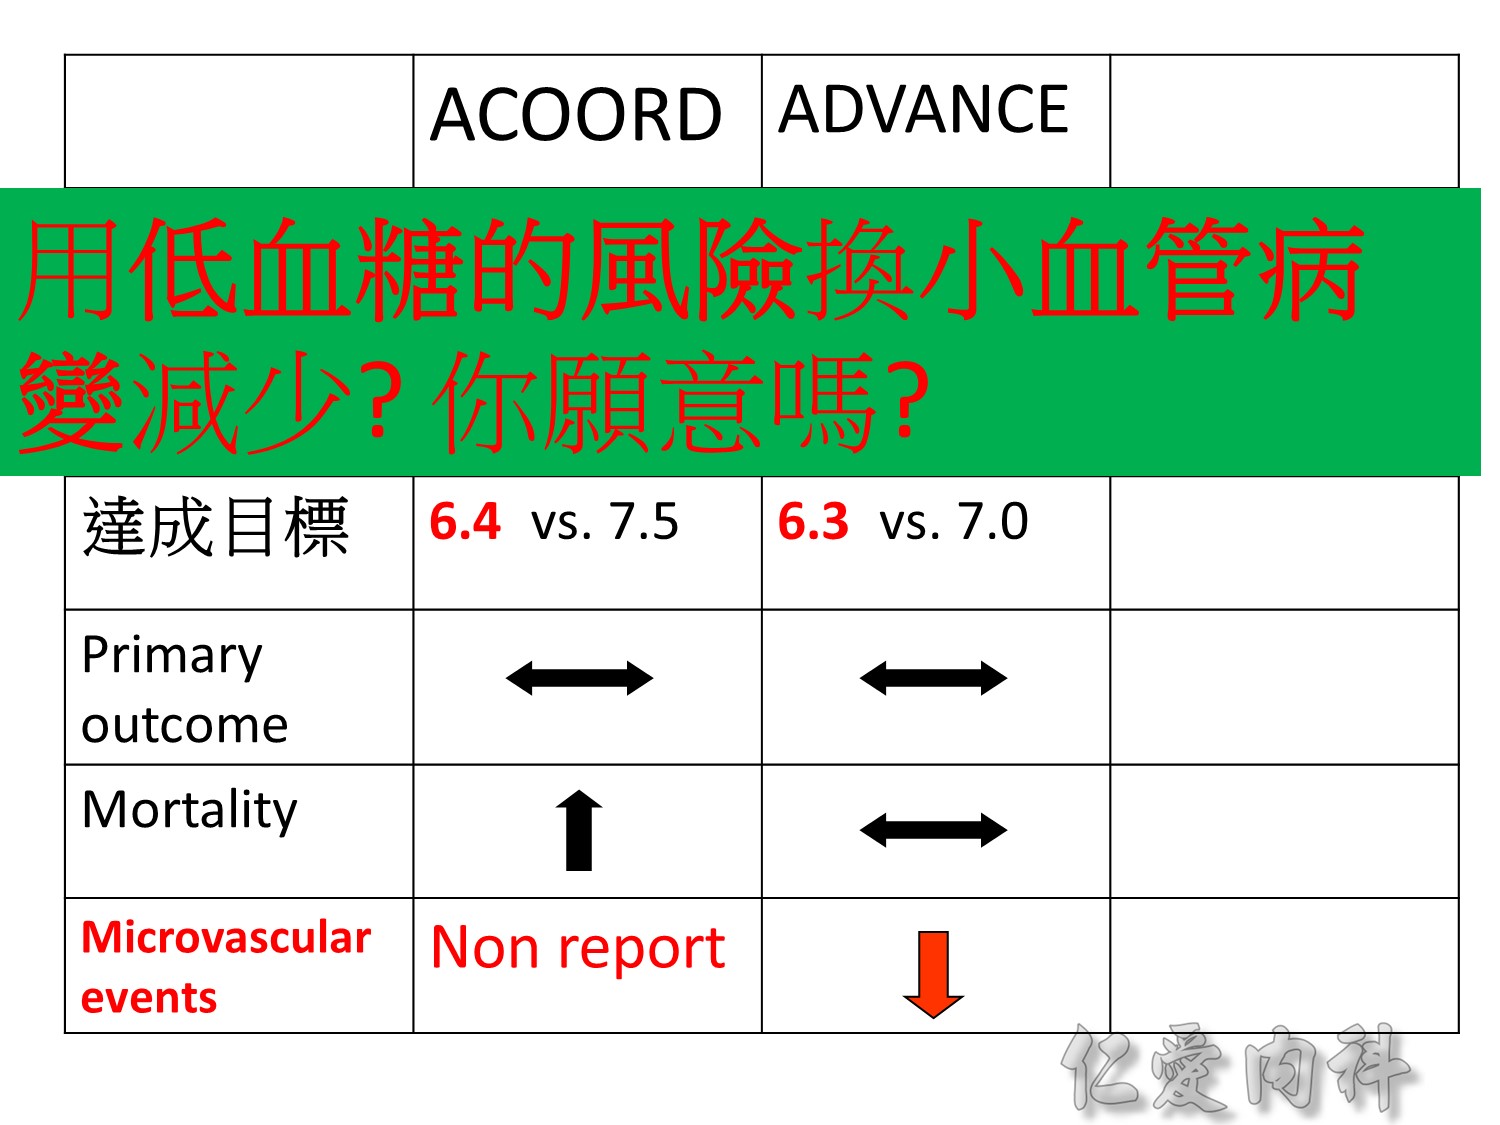
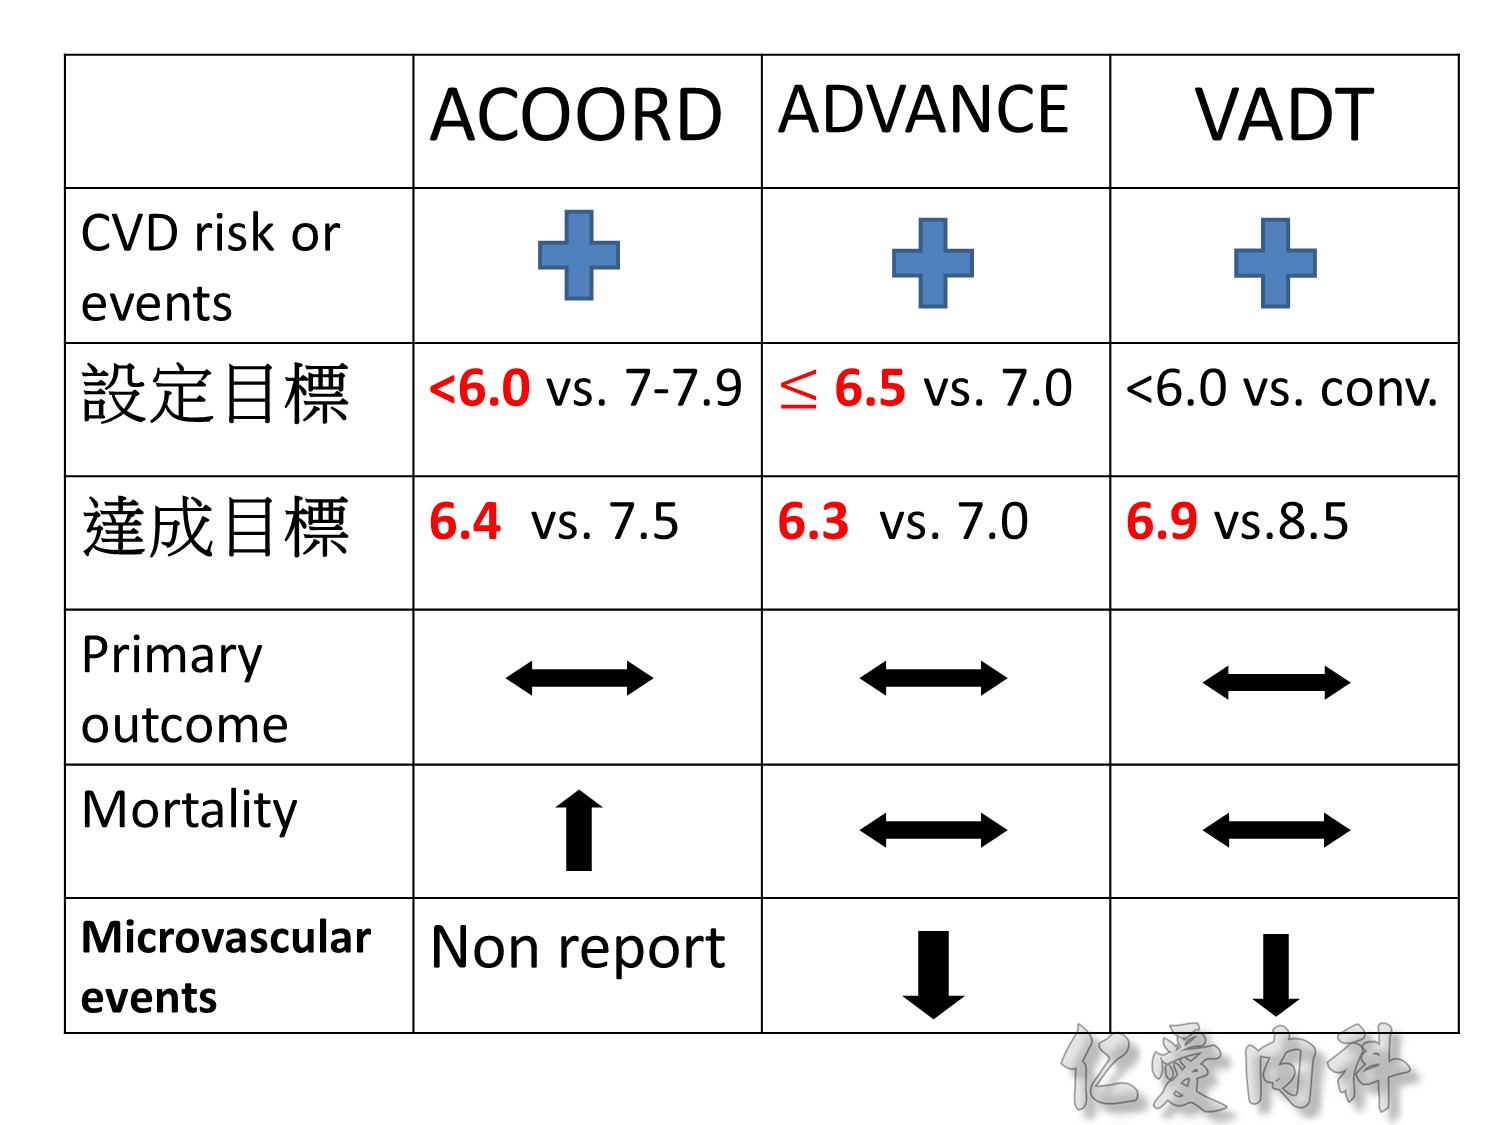
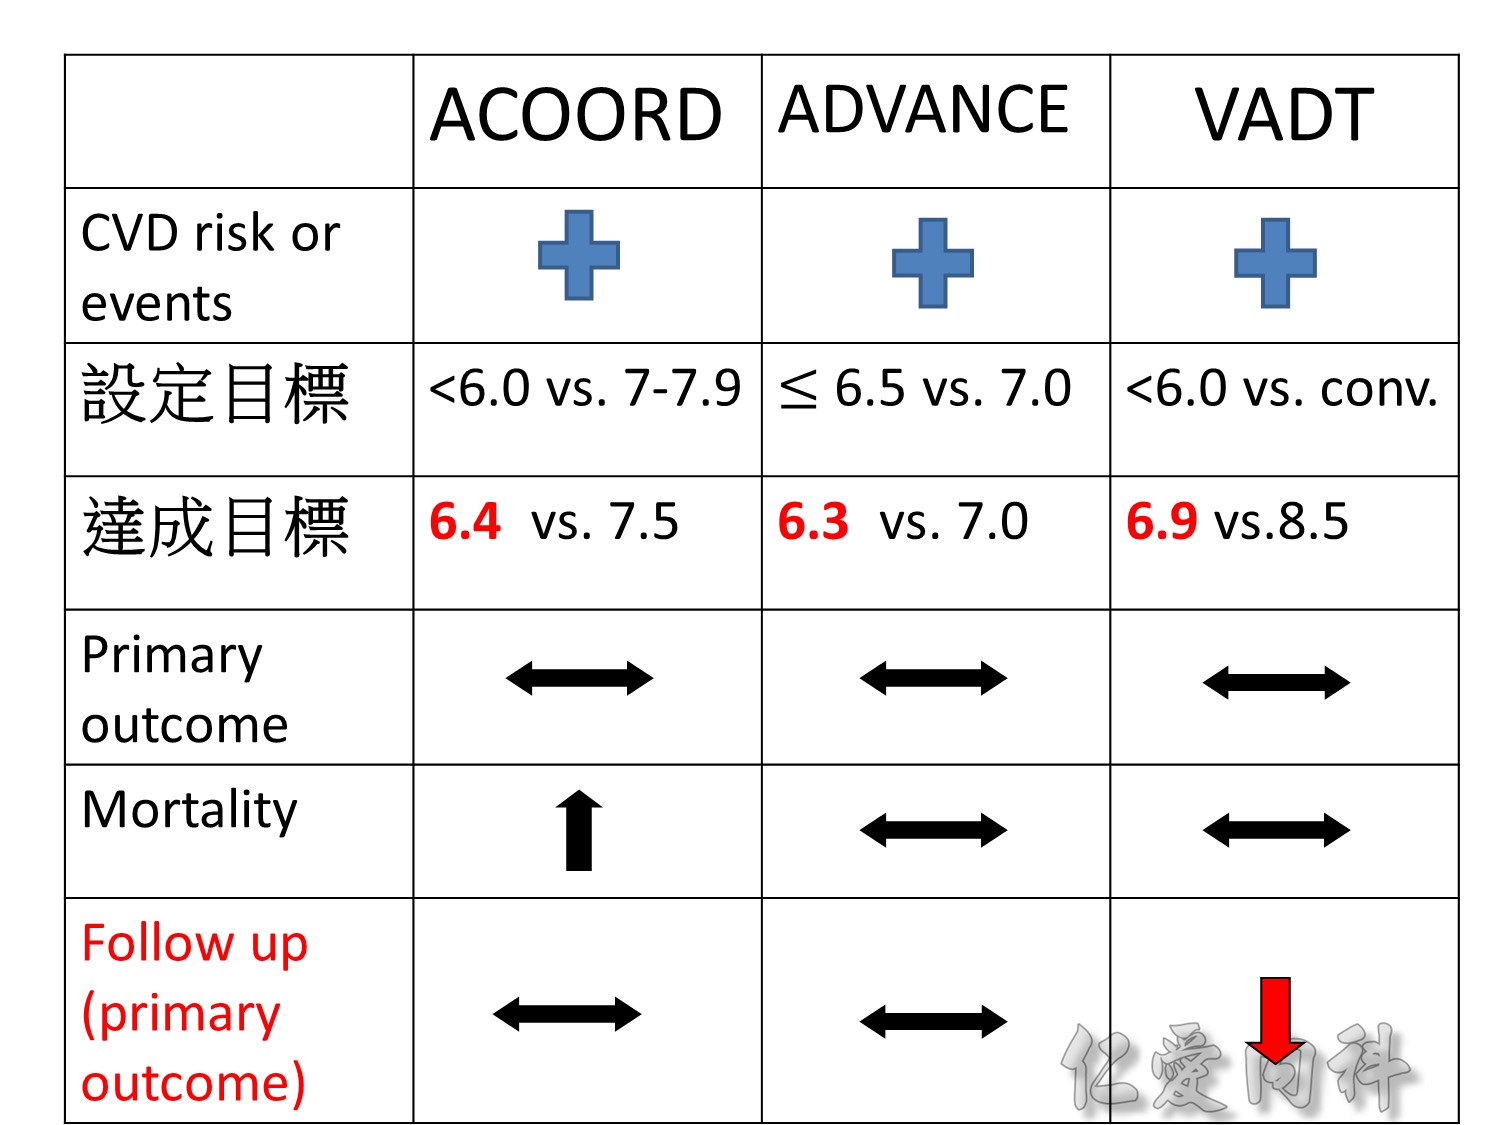
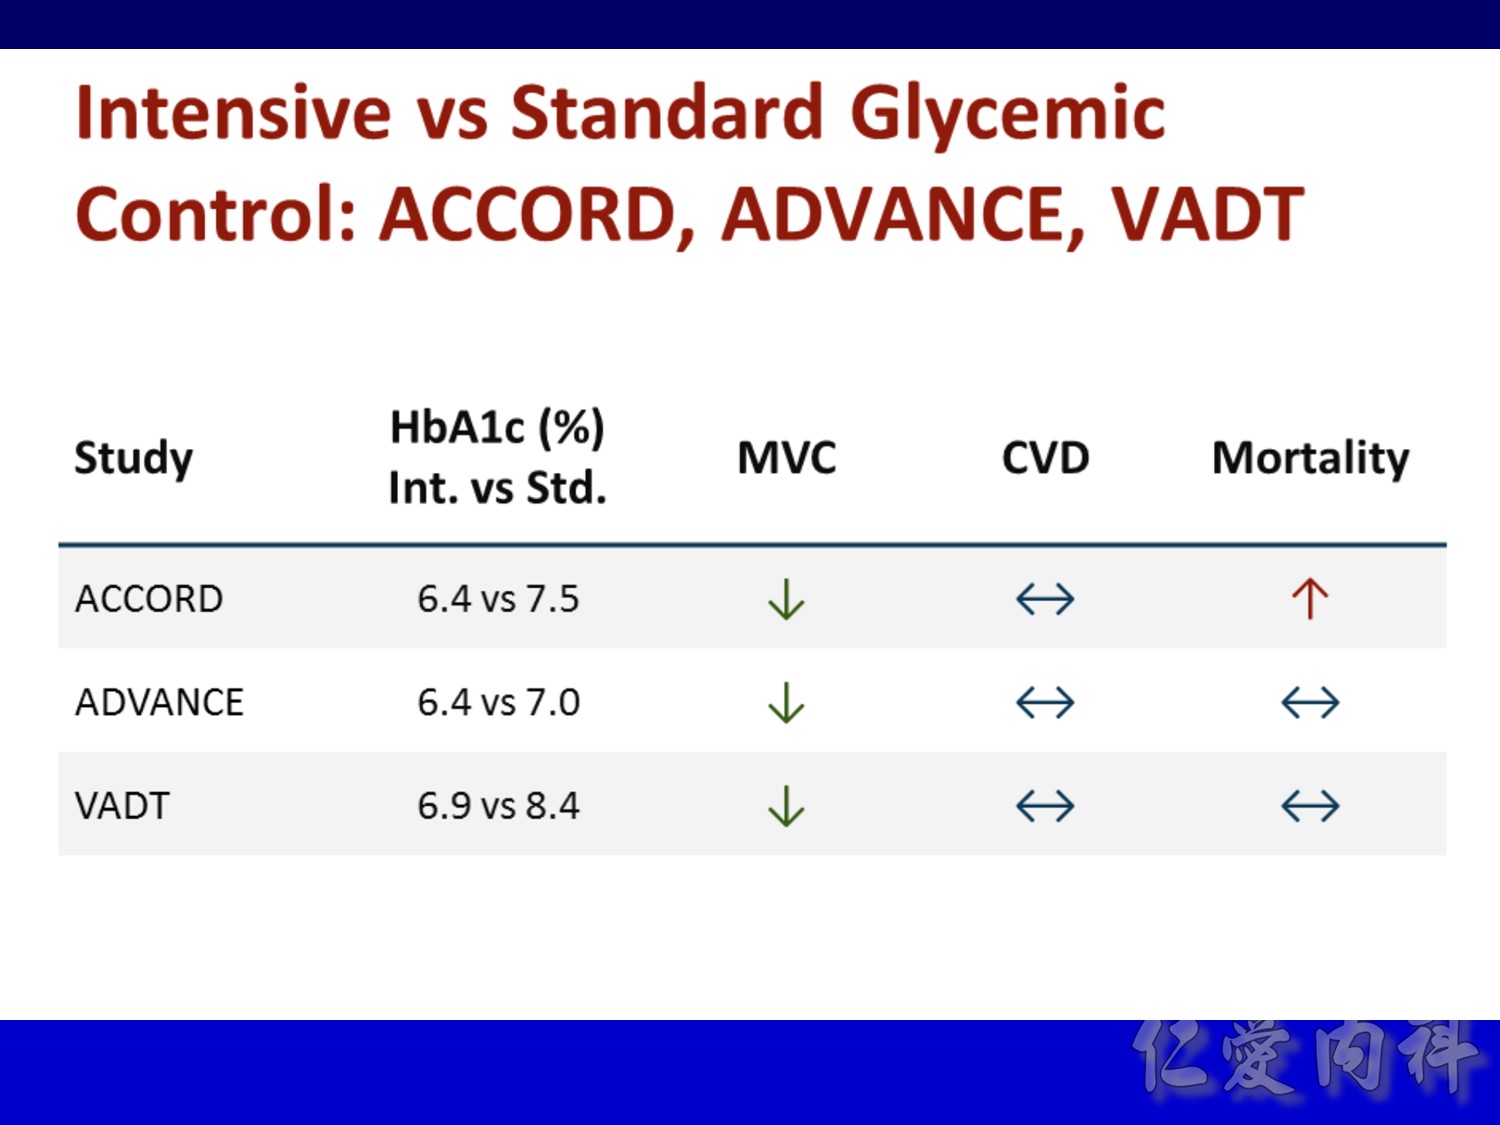
Microvascular outcomes are yet to be reported for the ACCORD (Action to Control Cardiovascular Risk in Diabetes) study. As compared with standard glucose control, intensive glucose control increased mortality (p=0.04) and did not significantly reduce major CV events.5
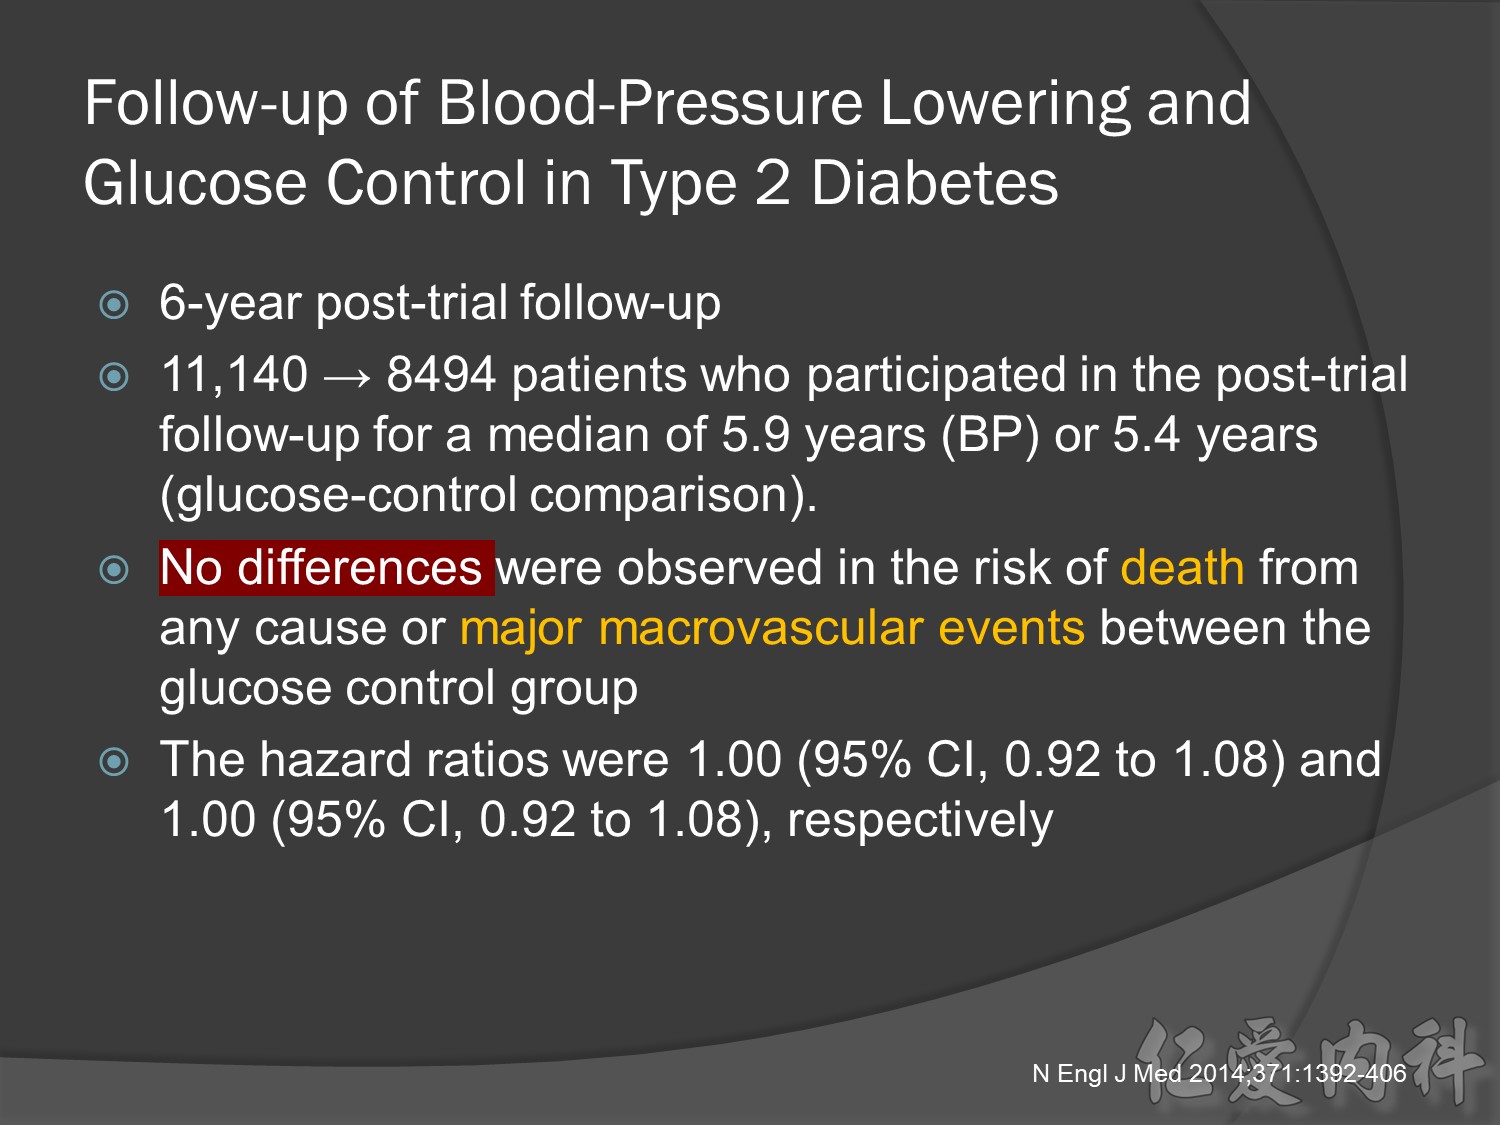
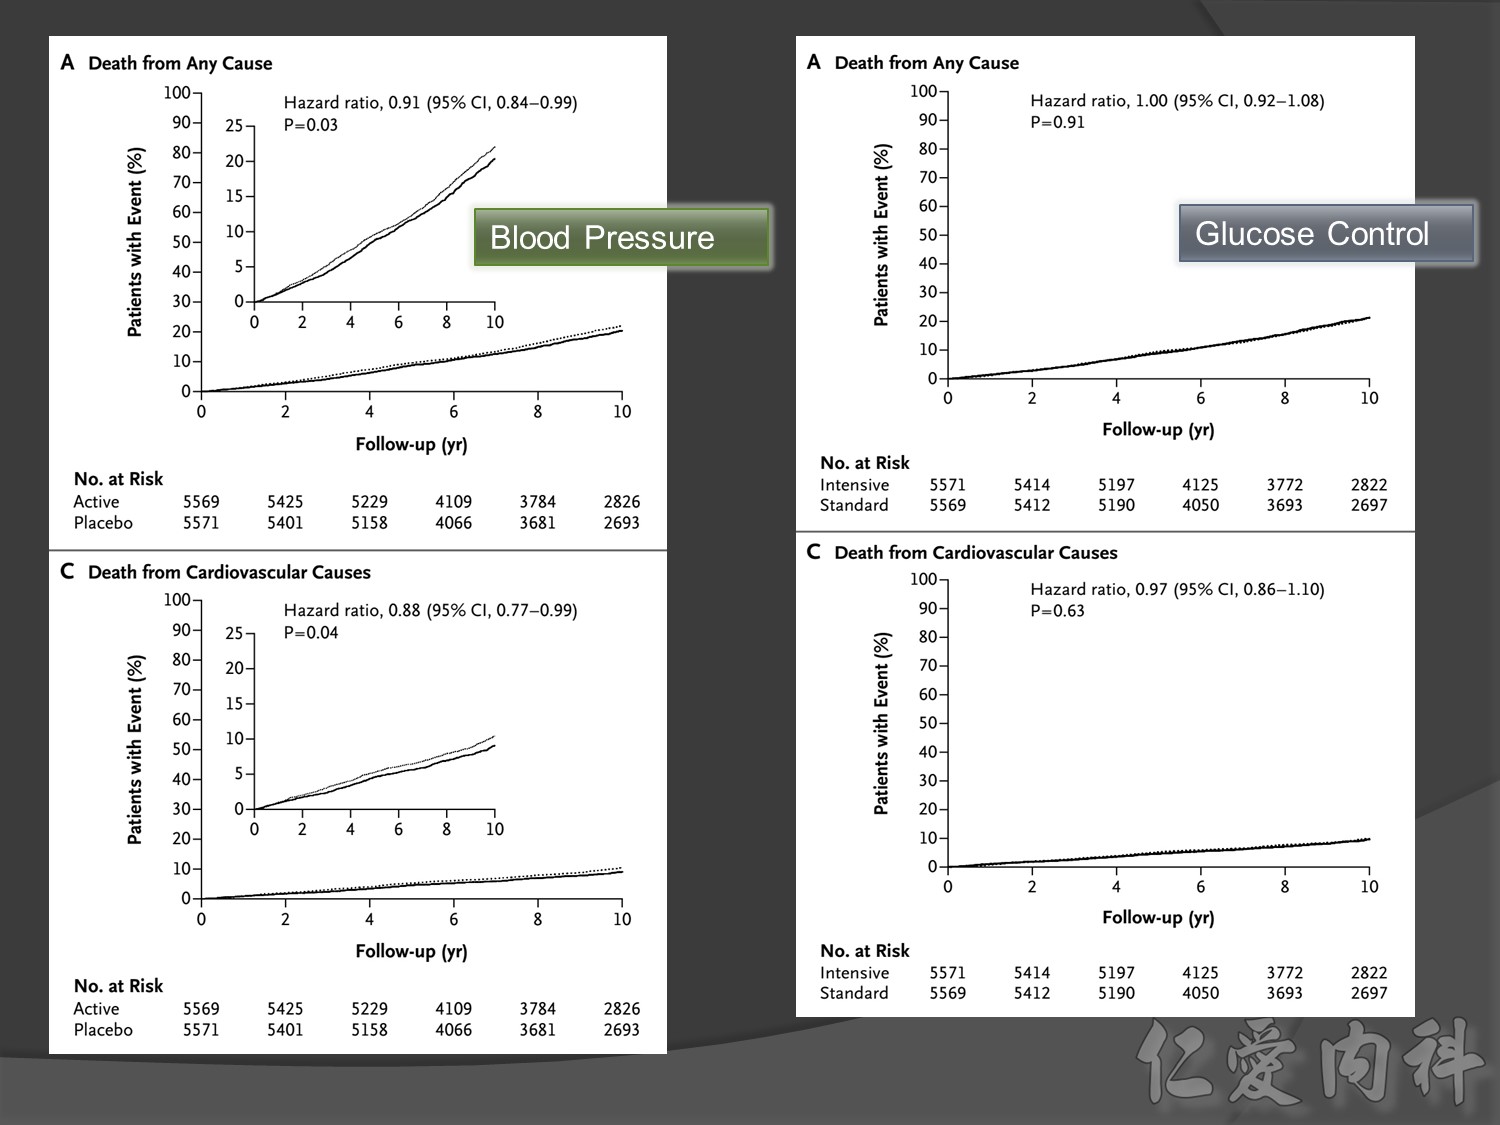
In ADVANCE (Action in Diabetes and Vascular Disease: Preterax and Diamicron-MR Controlled Evaluation), intensive glucose control was associated with a significant reduction (p=0.01) in the relative risk of major microvascular events. There were no significant effects of the type of glucose control on death from CV causes (p=0.12) or death from any cause (p=0.28).6
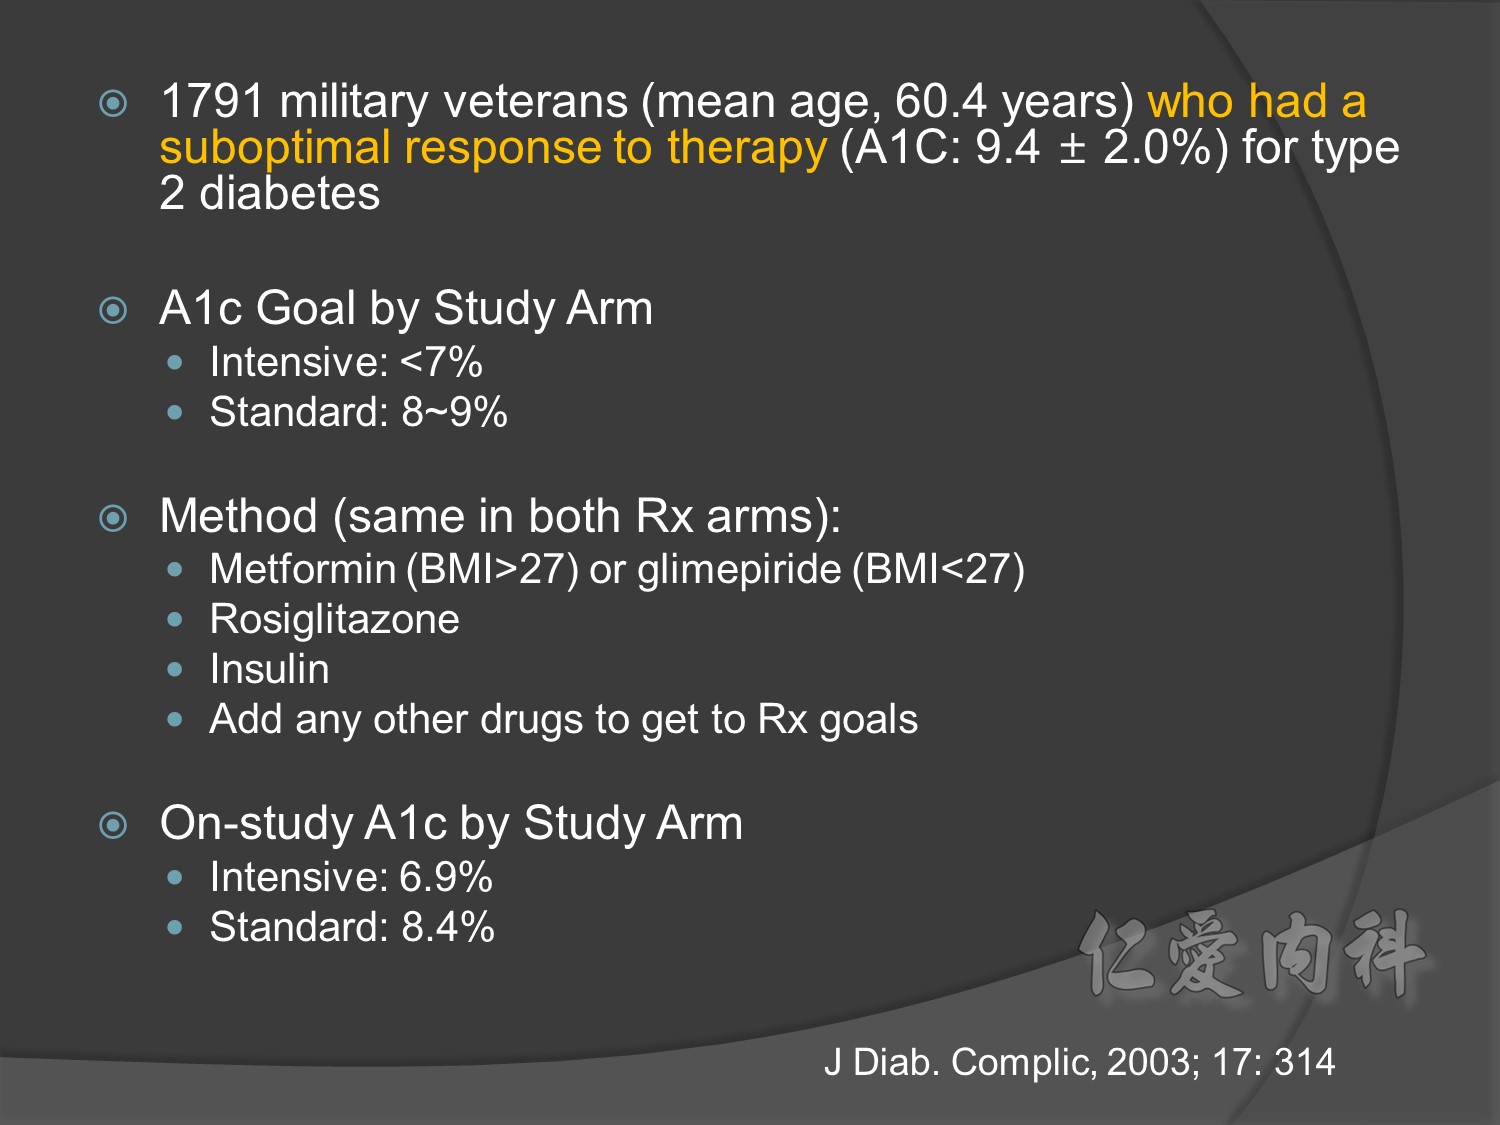
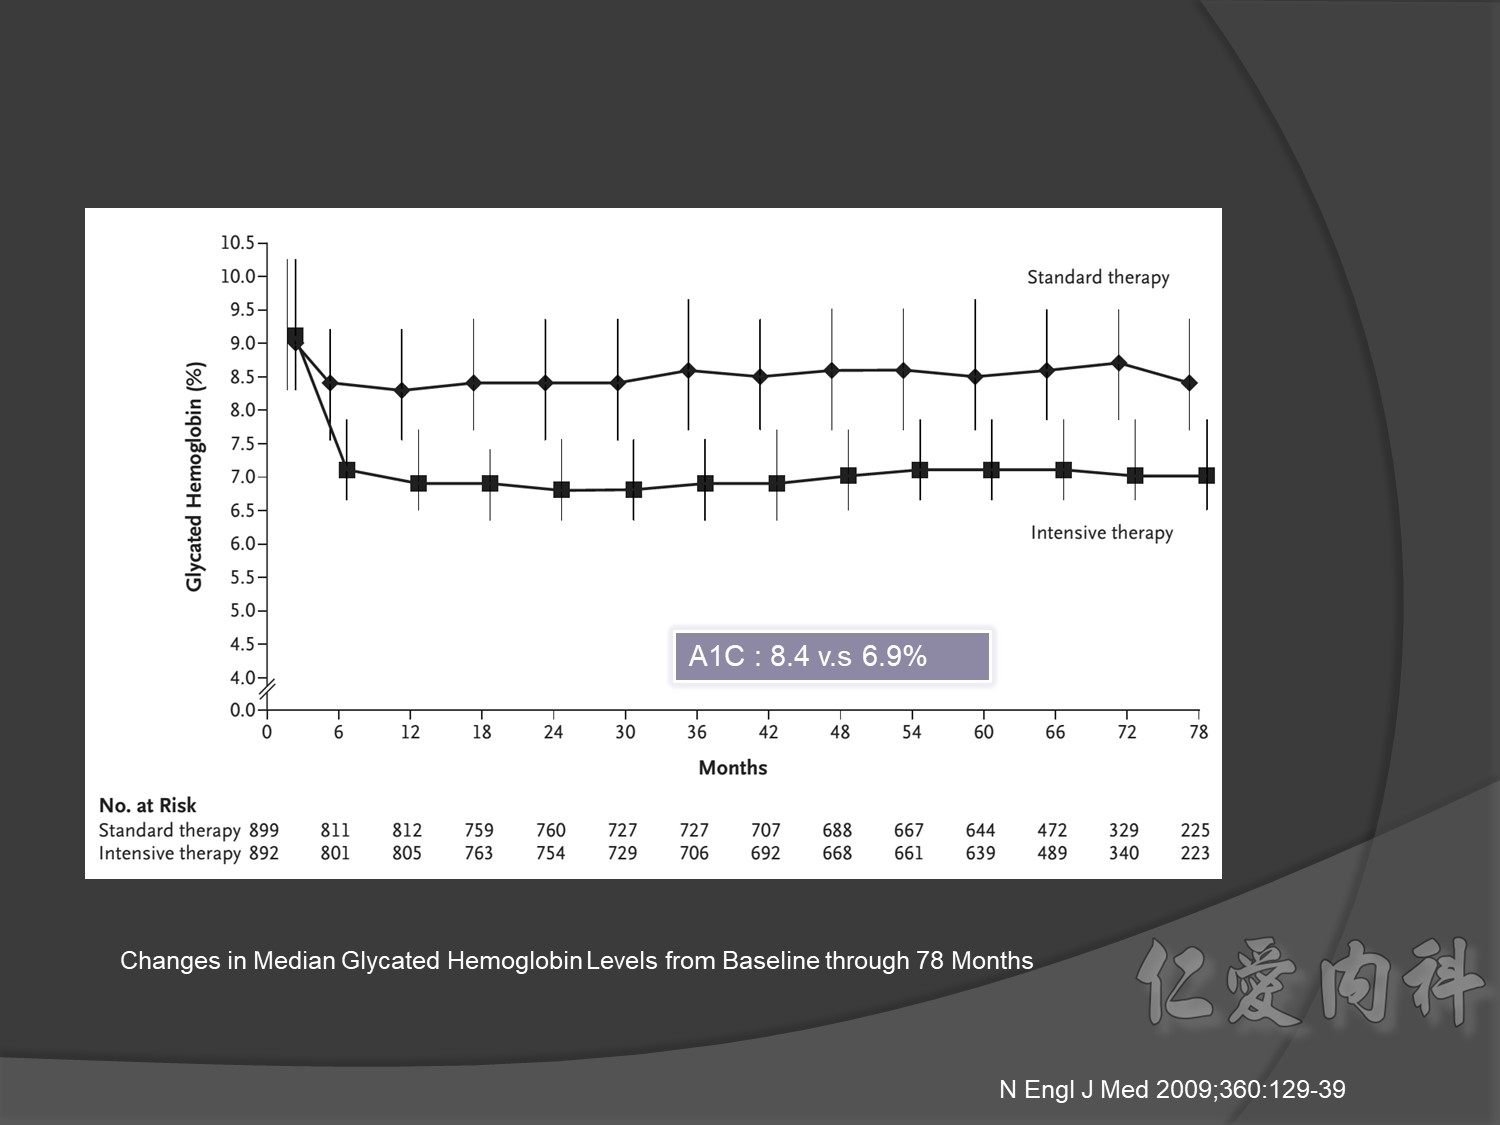
In VADT (Veterans Affairs Diabetes Trial), intensive glucose control had no significant effect on the rates of major CV events or death. The results showed that any worsening of albumin excretion was greater in the standard therapy group (p=0.05).7
DCCT/EDIC. JAMA 2002;287:2563–2569.
DCCT/EDIC. N Engl J Med 2005;353:2643–2653.
UKPDS Group. Lancet 1998;352:837–853.
Holman R, et al. N Engl J Med 2008;359:1577–1589.
ACCORD Study Group. N Engl J Med 2008;358:2545–2559.
ADVANCE Collaborative Group. N Engl J Med 2008;358:2560–2572.
Duckworth W, et al. N Engl J Med 2009;360:129–139.
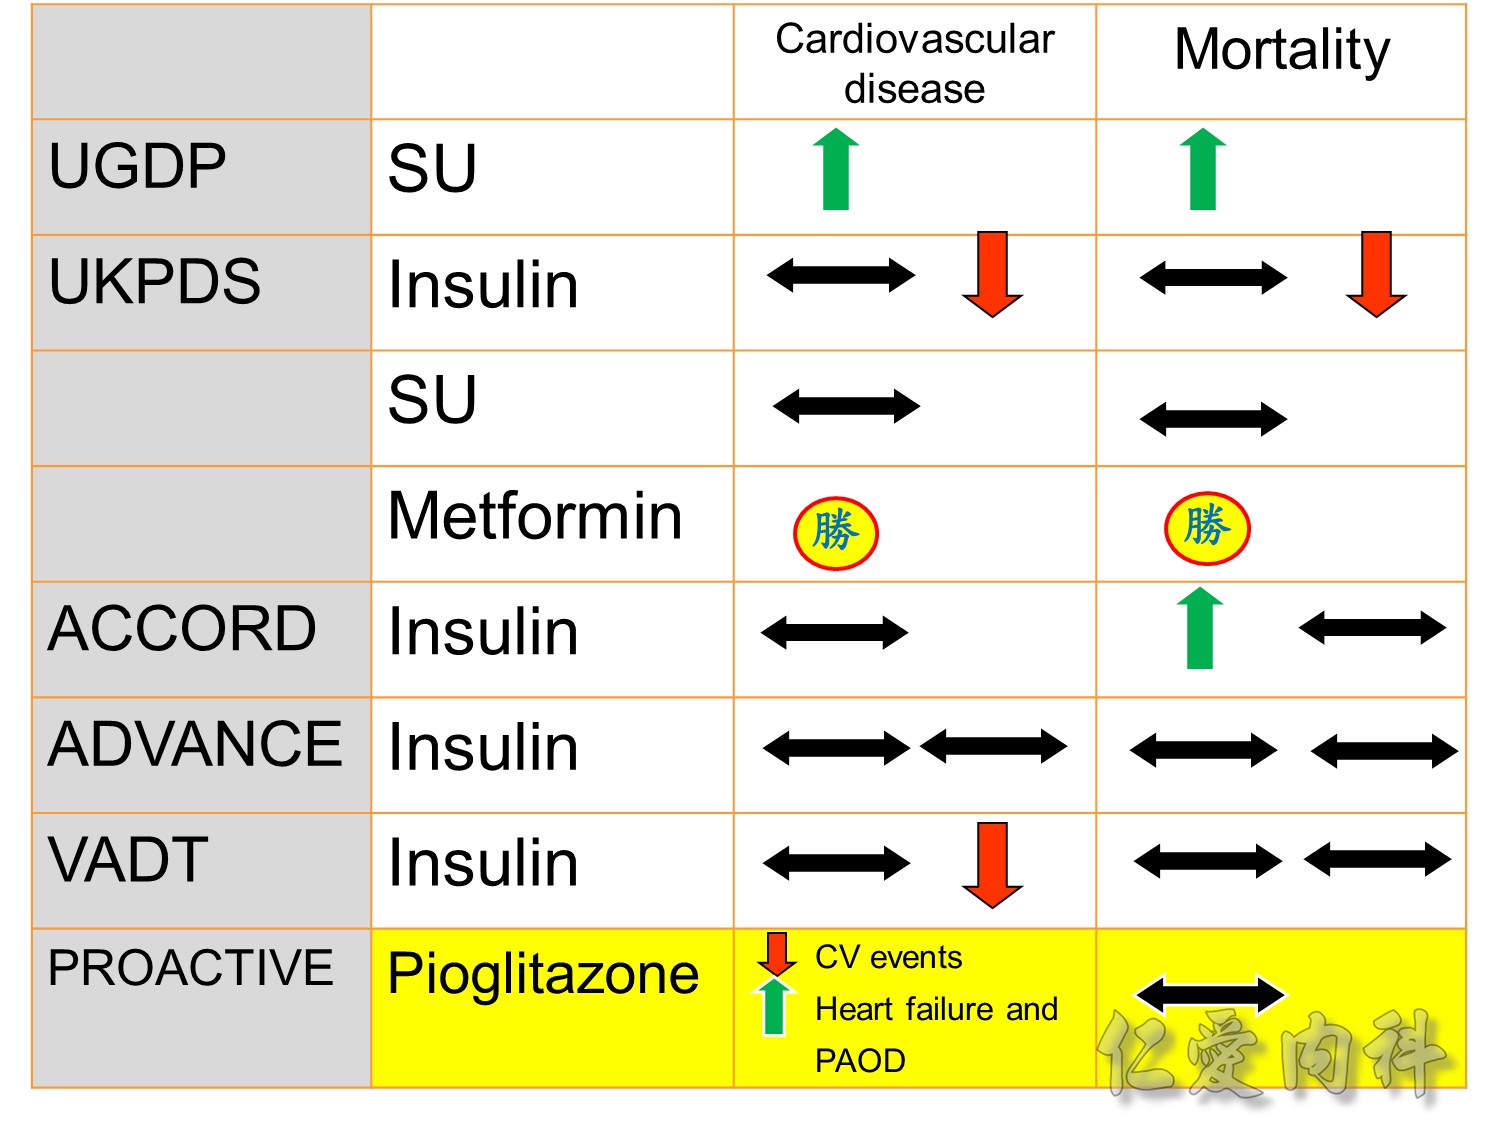
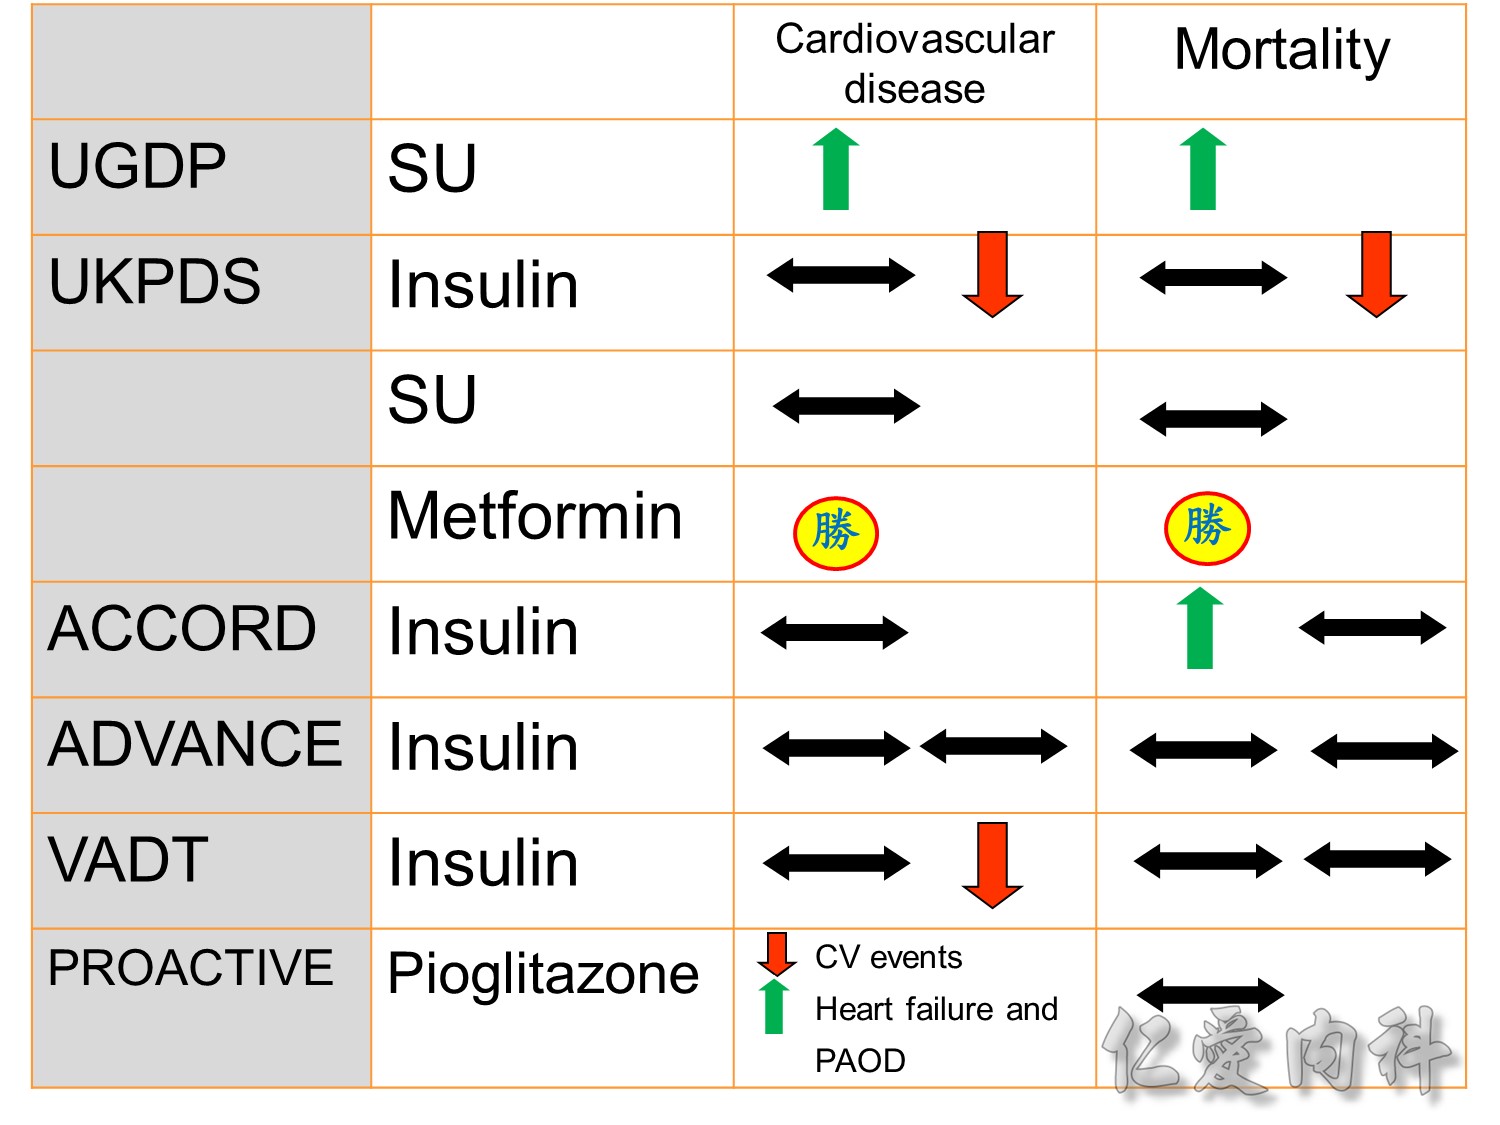
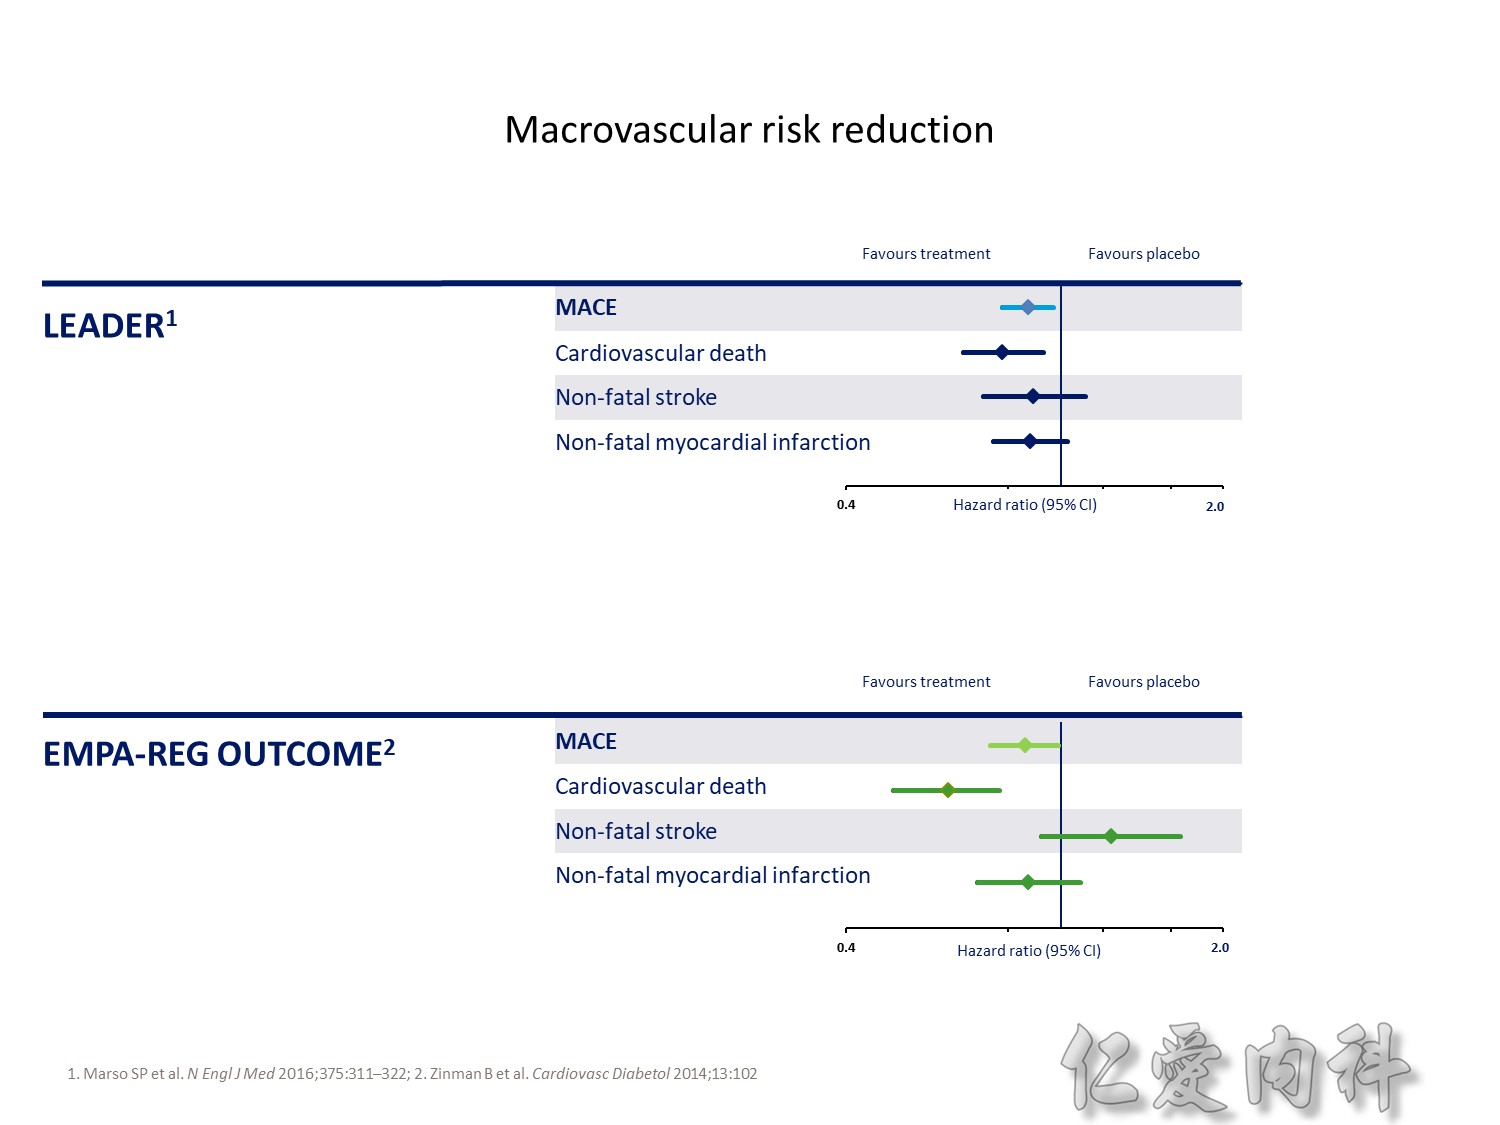
The DCCT (Diabetes Control and Complications Trial) showed that intensive treatment reduced the risks of retinopathy, nephropathy, and neuropathy by 35% to 90% compared with conventional treatment.1 These risk reductions were maintained through 7 years of follow-up in EDIC (Epidemiology of Diabetes Interventions and Complications).1 Risk reductions emerged for any cardiovascular (CV) disease event (p=0.02) in EDIC for patients who had received intensive treatment in DCCT.2 Mortality did not differ between the groups and was less than expected on the basis of population-based mortality studies.1
In the UKPDS (United Kingdom Prospective Diabetes Study), relative reductions in risk associated with intensive glucose control persisted at 10 years for microvascular disease (p=0.001).3,4 Post-trial risk reductions emerged for myocardial infarction (p=0.014) and death from any cause (p=0.007).3,4
Microvascular outcomes are yet to be reported for the ACCORD (Action to Control Cardiovascular Risk in Diabetes) study. As compared with standard glucose control, intensive glucose control increased mortality (p=0.04) and did not significantly reduce major CV events.5
In ADVANCE (Action in Diabetes and Vascular Disease: Preterax and Diamicron-MR Controlled Evaluation), intensive glucose control was associated with a significant reduction (p=0.01) in the relative risk of major microvascular events. There were no significant effects of the type of glucose control on death from CV causes (p=0.12) or death from any cause (p=0.28).6
In VADT (Veterans Affairs Diabetes Trial), intensive glucose control had no significant effect on the rates of major CV events or death. The results showed that any worsening of albumin excretion was greater in the standard therapy group (p=0.05).7
DCCT/EDIC. JAMA 2002;287:2563–2569.
DCCT/EDIC. N Engl J Med 2005;353:2643–2653.
UKPDS Group. Lancet 1998;352:837–853.
Holman R, et al. N Engl J Med 2008;359:1577–1589.
ACCORD Study Group. N Engl J Med 2008;358:2545–2559.
ADVANCE Collaborative Group. N Engl J Med 2008;358:2560–2572.
Duckworth W, et al. N Engl J Med 2009;360:129–139.
Origin(DM and pre DM with CAD): LevemirèNS
MARH èmetformin
Stop NIDDM Acarbose =è 下降CV event
Navigator:NateglinideèCV NS

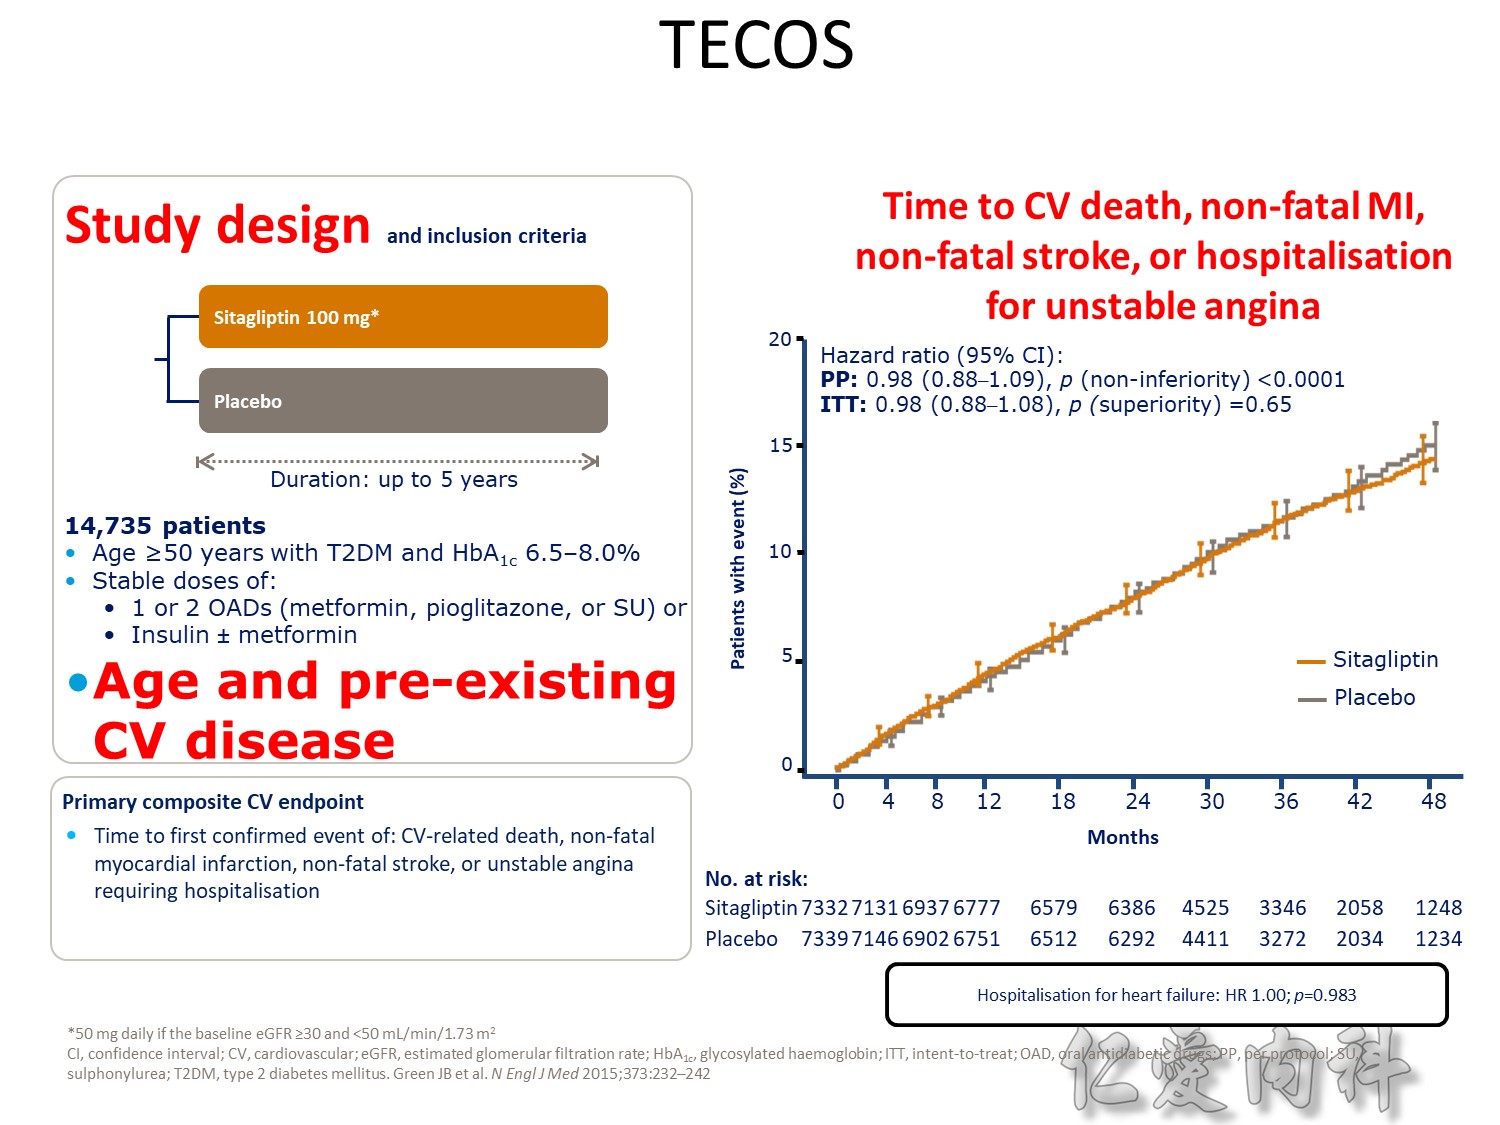
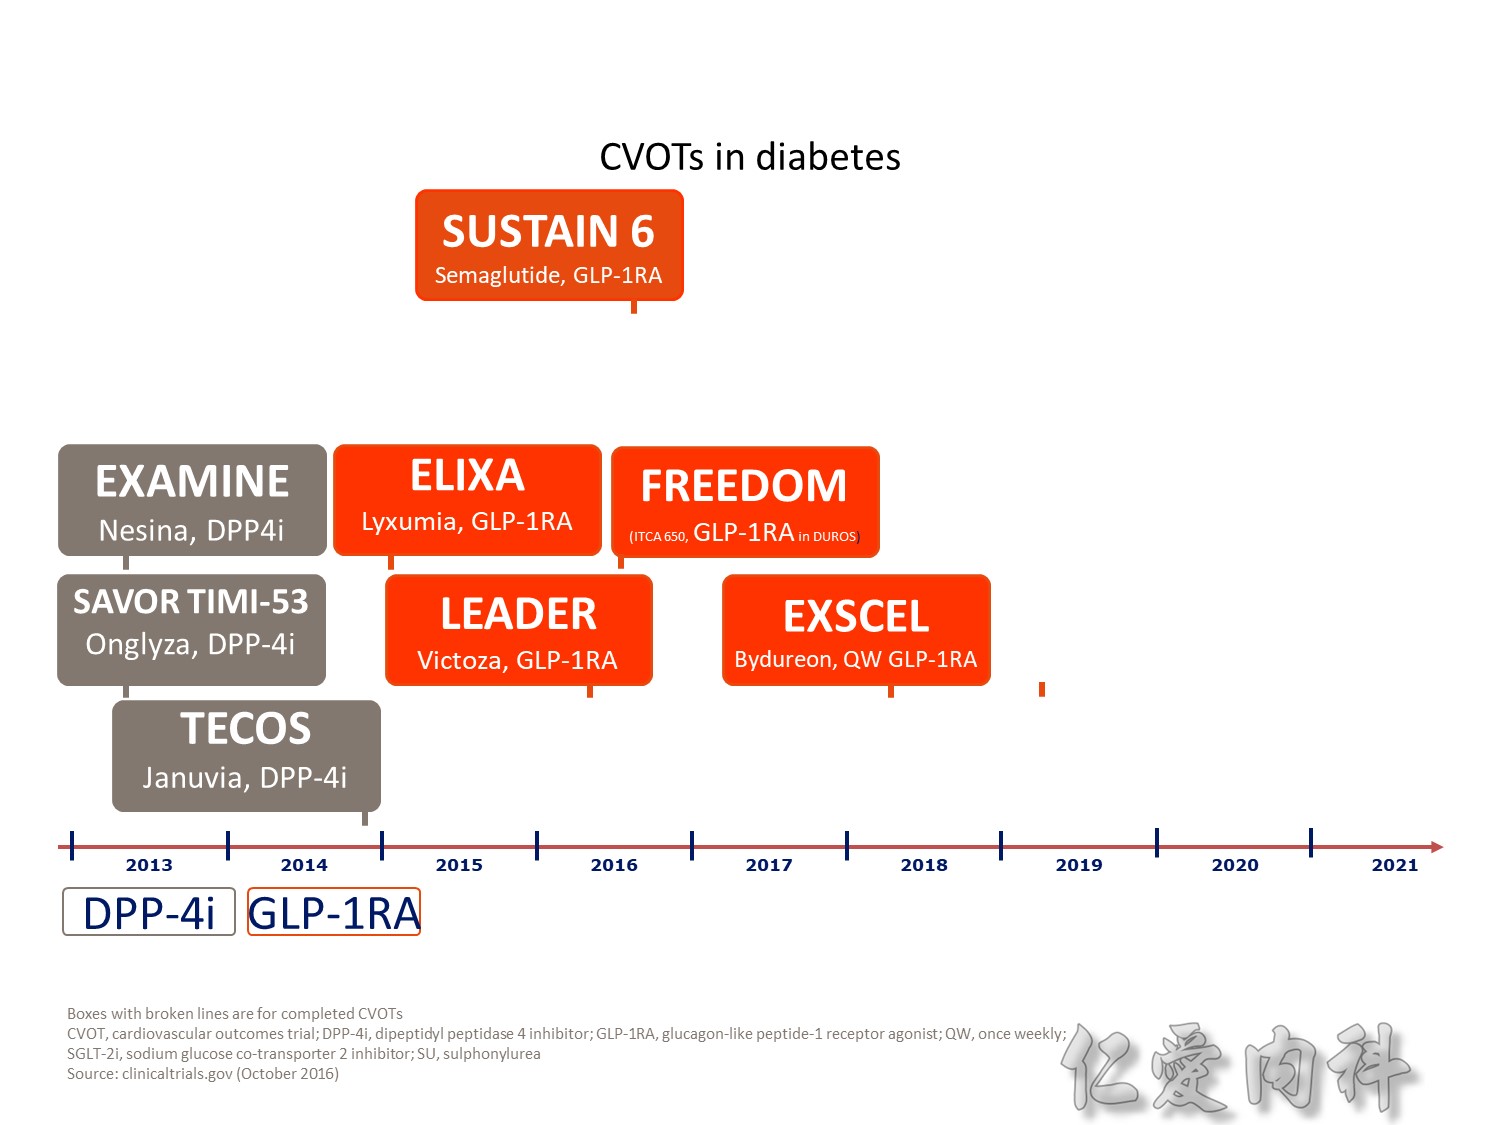
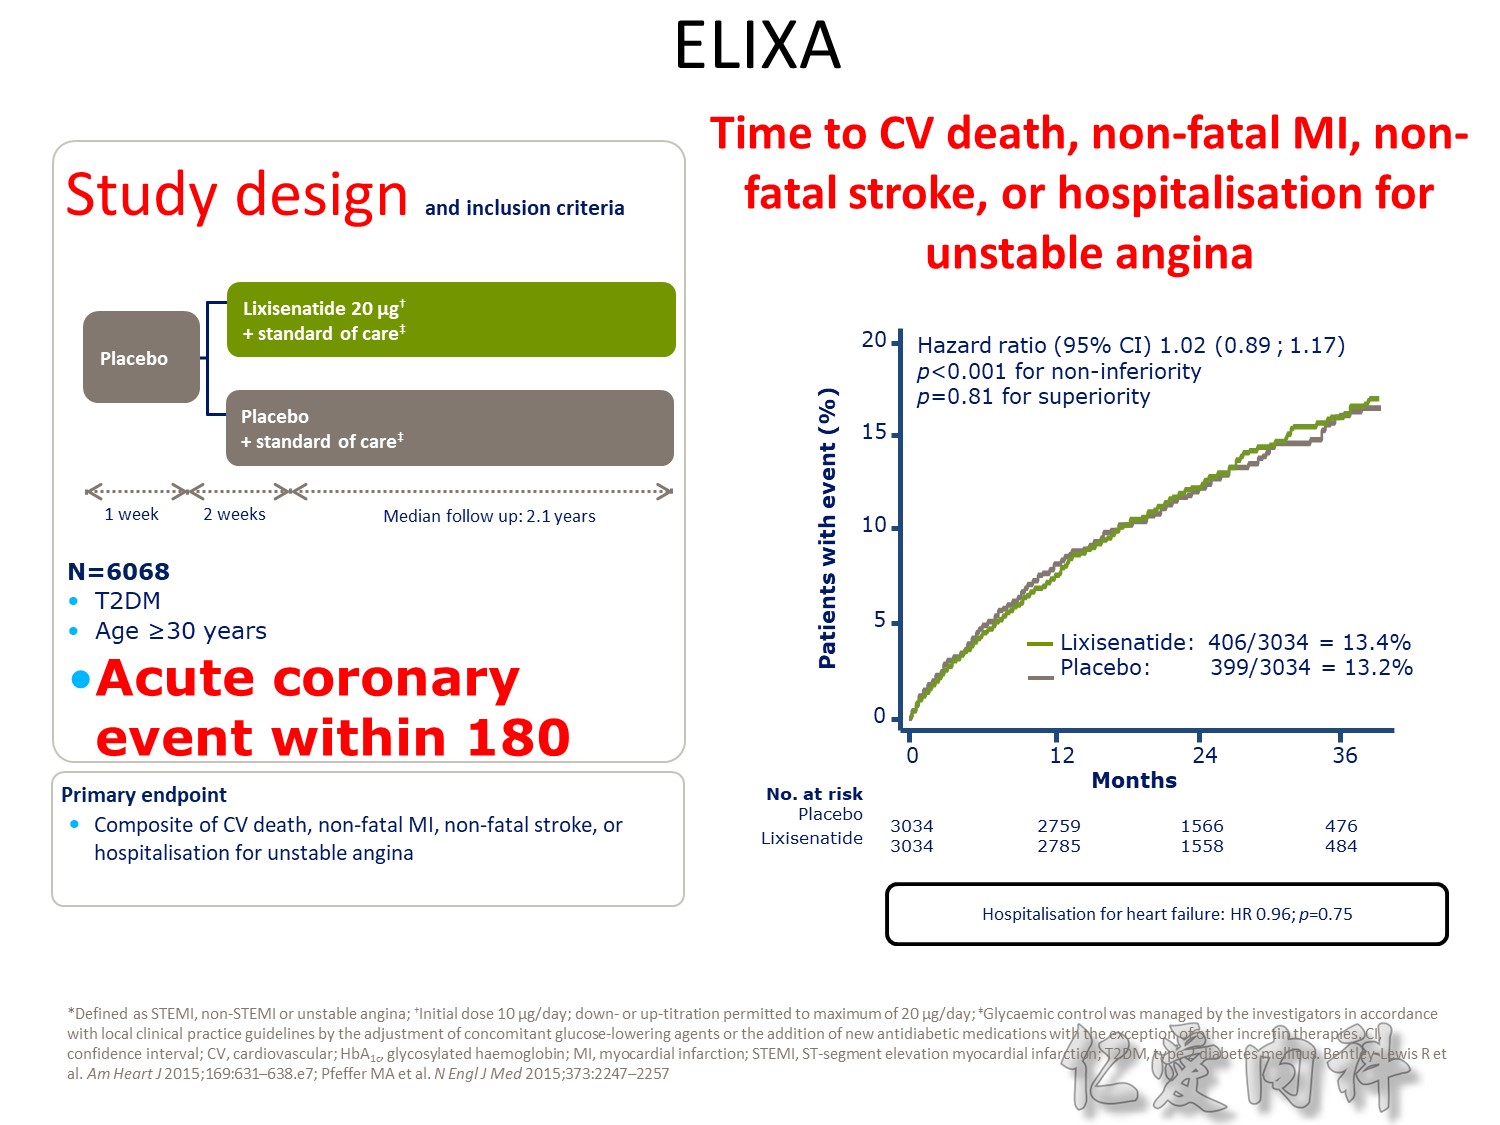
CV safety trial 的時代來臨

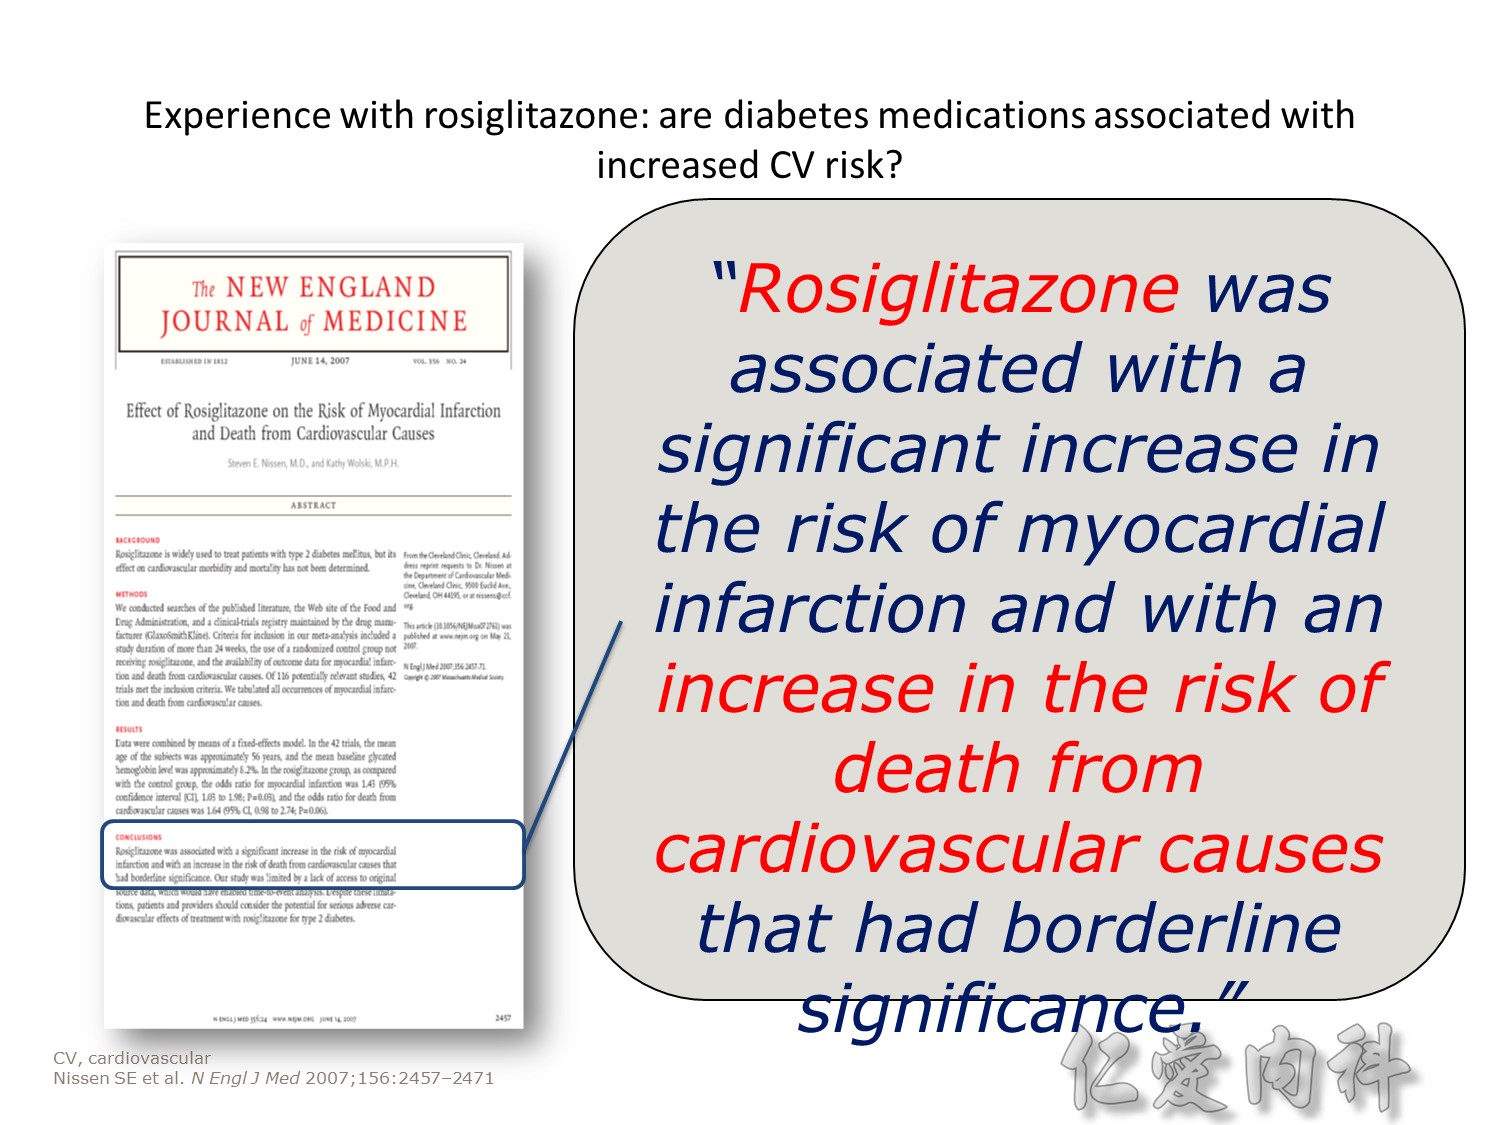
Publication of meta-analysis in NEJM
Statistically significant increase in myocardial infarction and borderline significant increase in cardiovascular mortality
Surprisingly little is known about the long-term effects of antidiabetic agents on the cardiovascular system. Indeed, recent studies have shown that several groups of currently available diabetic drugs cause specific concerns, which may explain, in part, the lack of improved cardiovascular outcomes from the treatment of diabetes using specific agents.
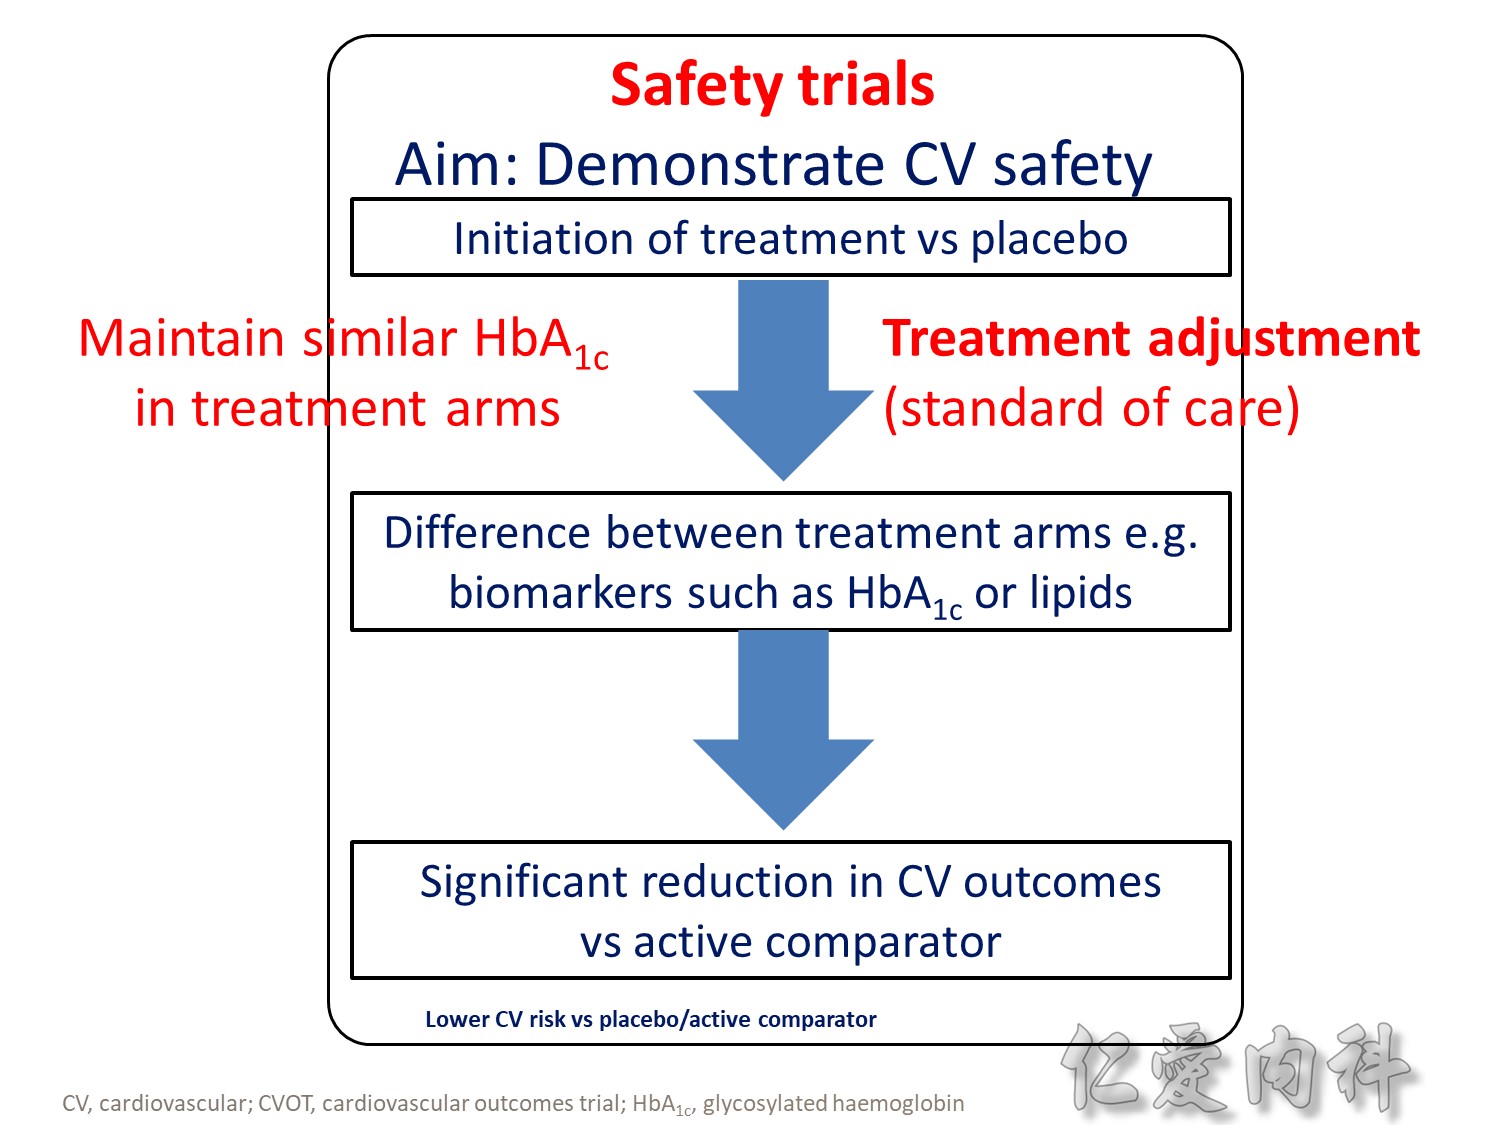
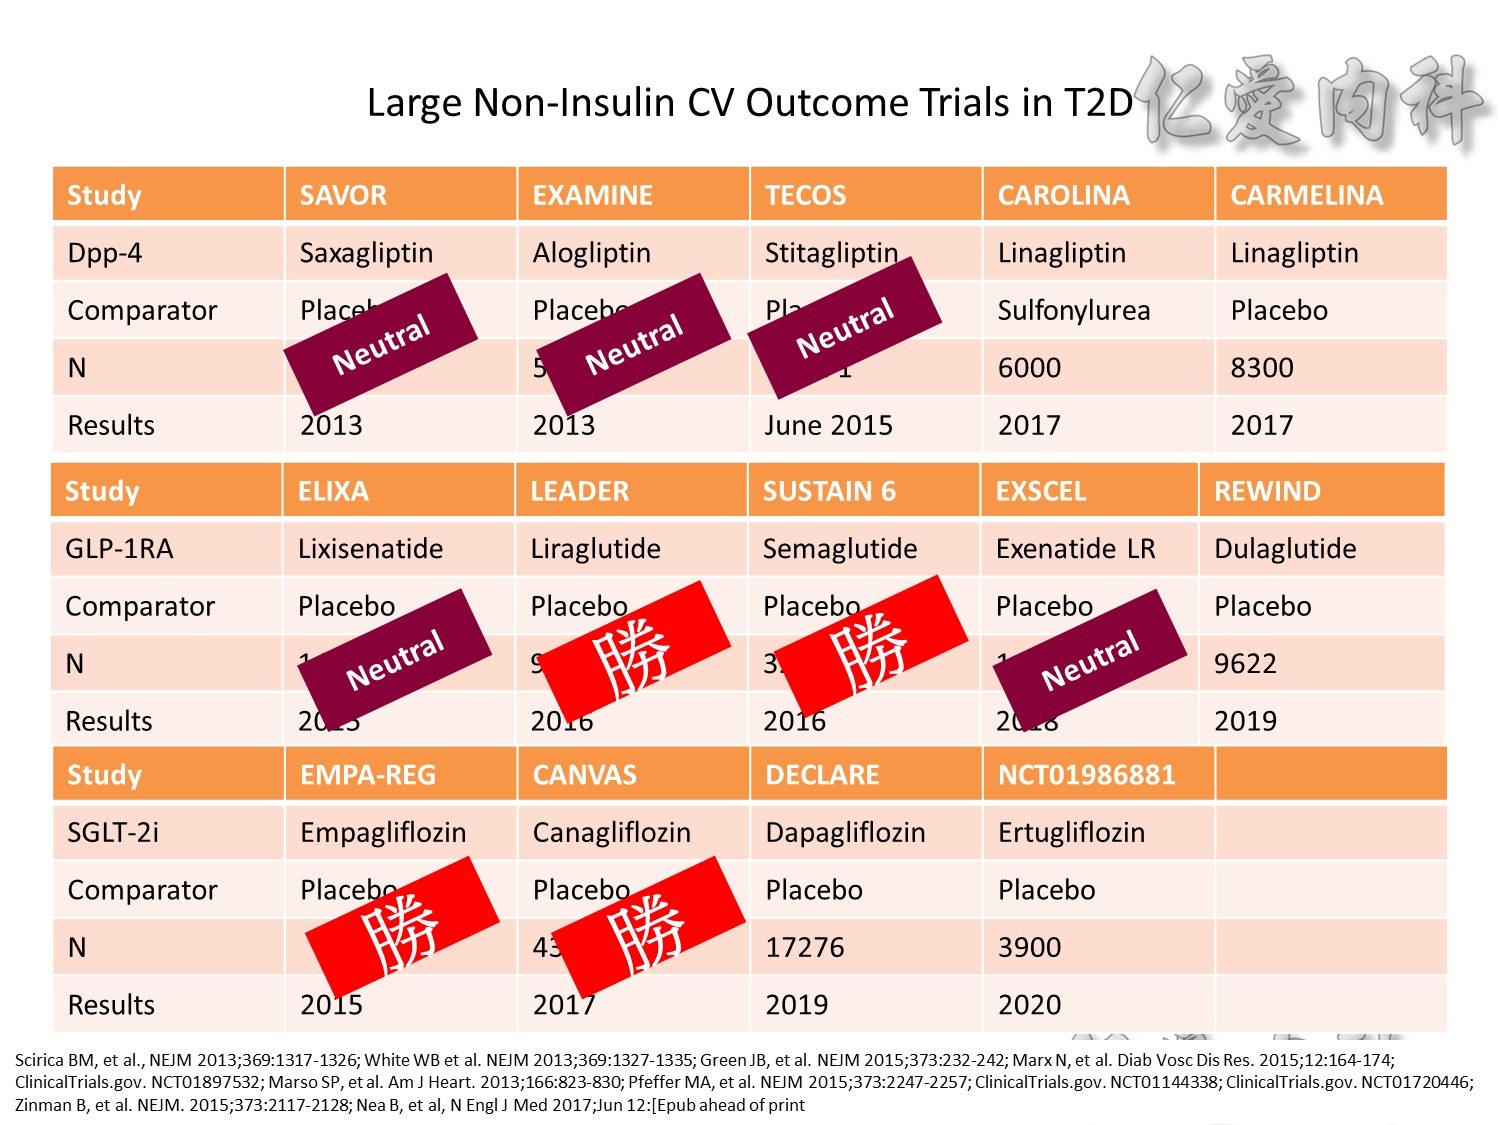
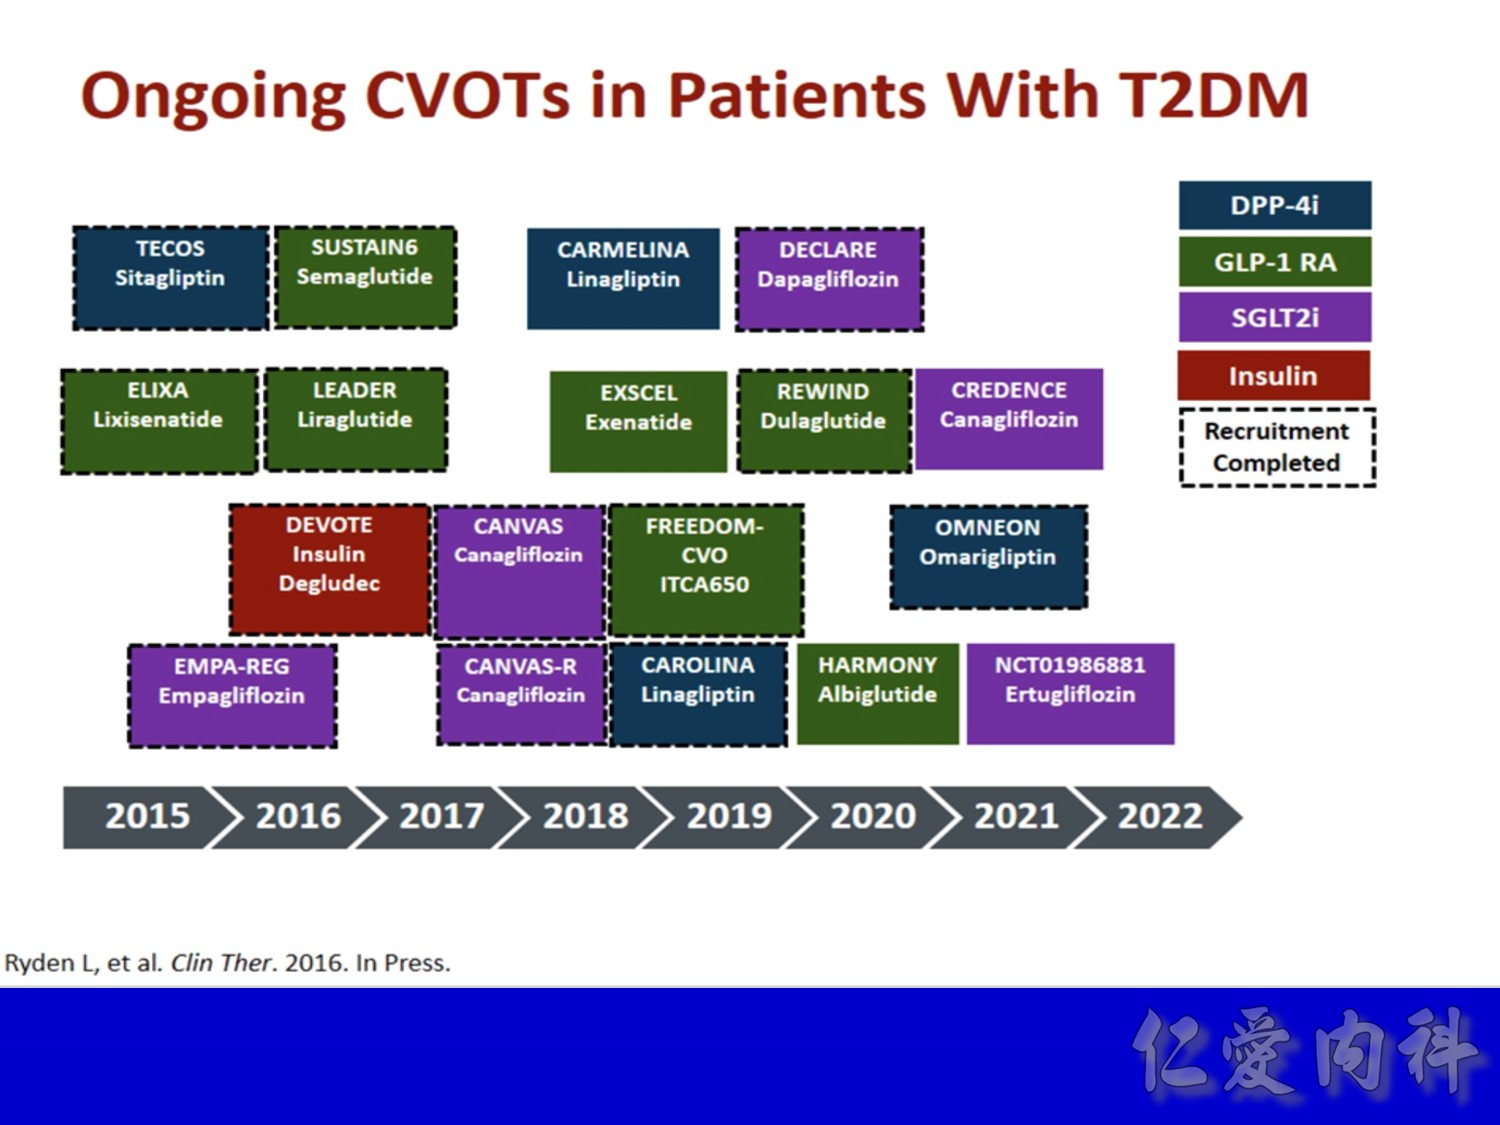
- Outcomes trials are a robust way to evaluate the efficacy and safety of therapies, generally involving large numbers of patients followed over long periods of time1
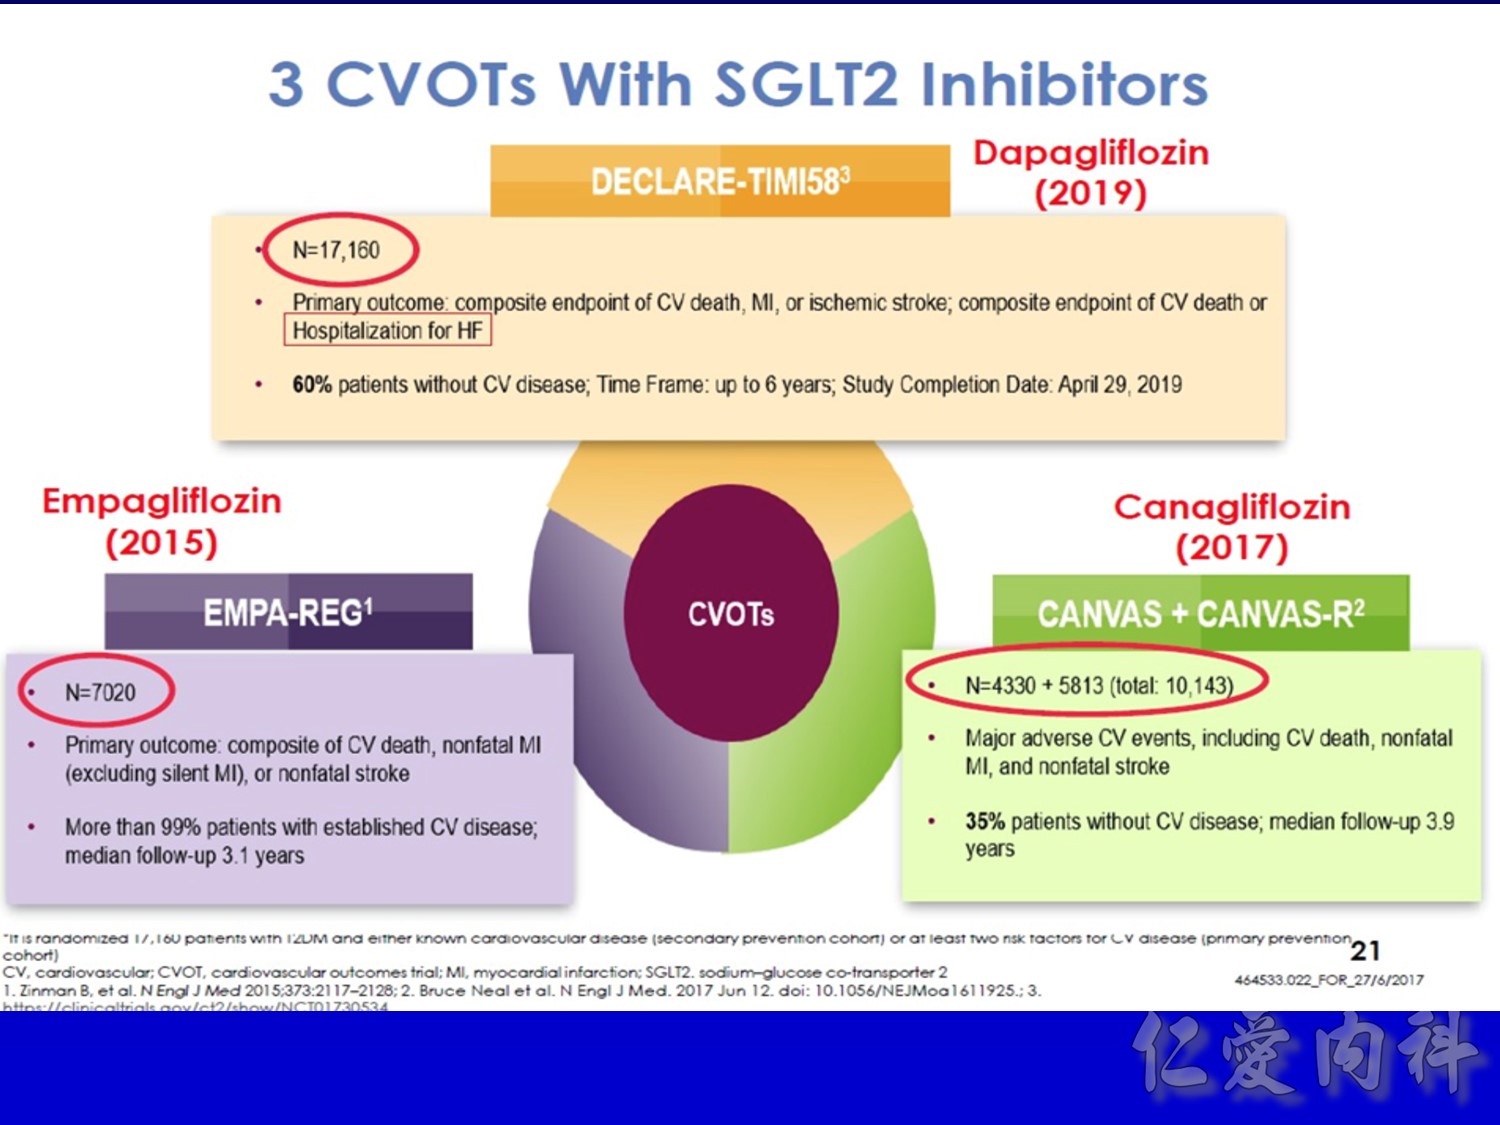
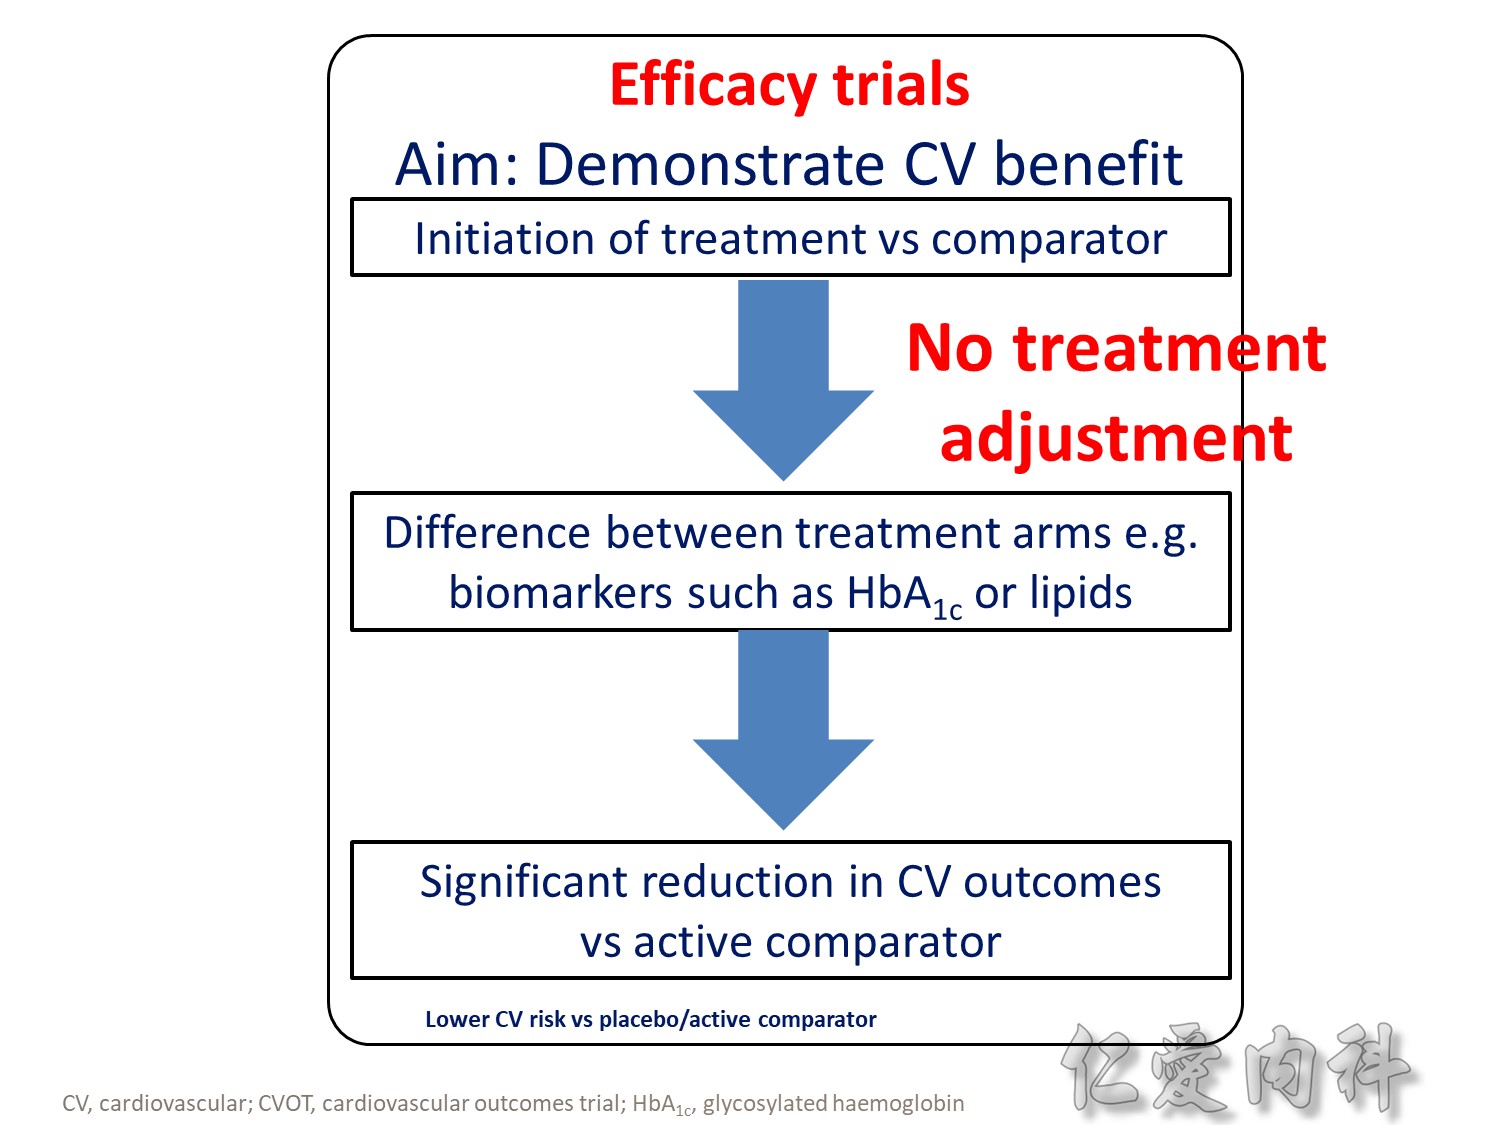
- Cardiology CVOTs are typically designed to demonstrate CV benefit vs. an active comparator
- CVOTs in the therapy area of diabetes are conducted to rule out an unacceptable increase in cardiovascular risk for a new treatment
- If superiority is a pre-defined endpoint, it will be assessed if and only if non-inferiority is confirmed
- An aim of diabetes CVOTs is to optimise the treatment of patients in all arms and make them as comparable as possible except for the exposure to trial product
- Drug-specific CVOTs in diabetes are distinguishable from glycaemic control-focused studies (e.g. ACCORD, ADVANCE) that used multiple treatment modalities to achieve glycaemic targets
- CVOTs in diabetes are event-driven with MACE as a primary endpoint
- Almost all CVOTs within diabetes are placebo-controlled, testing the addition of the medication of interest or placebo to standard of care
- Event driven – designed to accrue a predefined number of end point events (e.g. CV death); the larger the required number of events, the larger or longer the trial needs to be
- MACE is considered a more stringent end point with arguably less ambiguity and bias and more certain ascertainment than some “softer” end points.
- The type of events chosen as end points may also have a bearing on the trial size; limiting events to MACE may require more patient-years to accrue compared with a broader spectrum of qualifying events
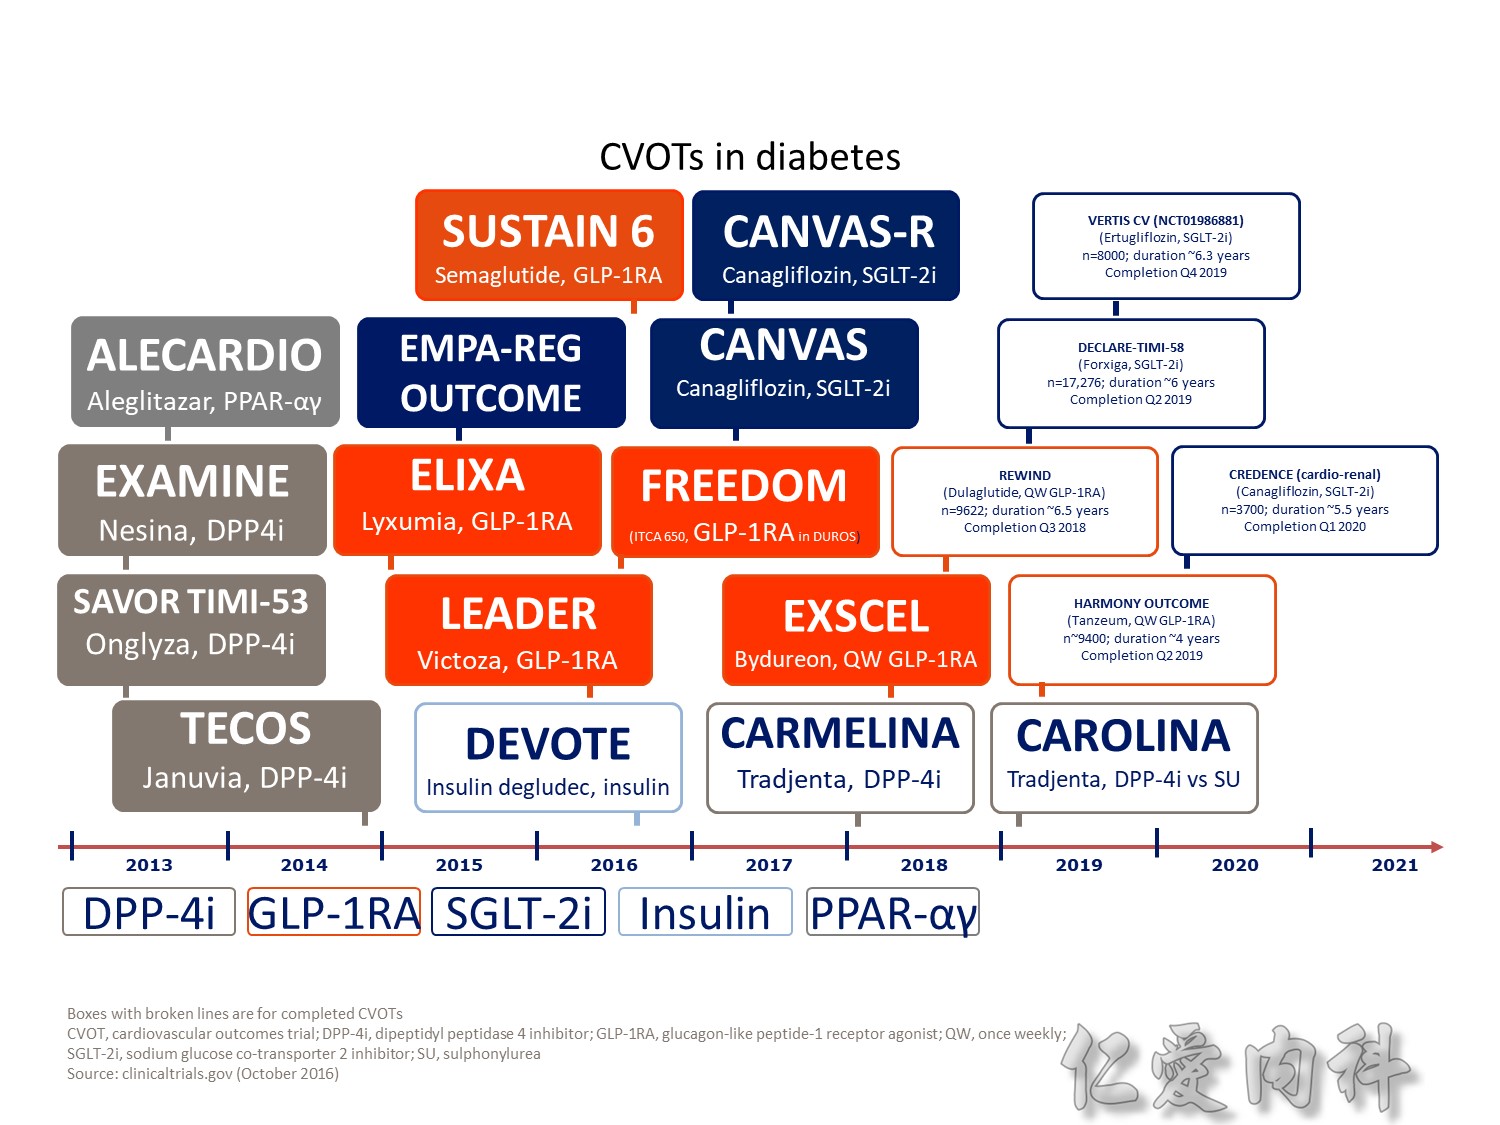
- One exception is CAROLINA, where the sulfonylurea glimepiride is the active comparator. This design may offer an additional benefit of testing efficacy parameters of linagliptin versus glimepiride in a long-term, head-to-head comparison; however, an FDA review had raised concerns related to the unknown CV effect of glimepiride, subsequently notifying the sponsor of their requirement to conduct a CV safety study with linagliptin versus placebo
- Outcomes trials are a robust way to evaluate the efficacy and safety of therapies, generally involving large numbers of patients followed over long periods of time1
- Cardiology CVOTs are typically designed to demonstrate CV benefit vs. an active comparator
- CVOTs in the therapy area of diabetes are conducted to rule out an unacceptable increase in cardiovascular risk for a new treatment
- If superiority is a pre-defined endpoint, it will be assessed if and only if non-inferiority is confirmed
- An aim of diabetes CVOTs is to optimise the treatment of patients in all arms and make them as comparable as possible except for the exposure to trial product
- Drug-specific CVOTs in diabetes are distinguishable from glycaemic control-focused studies (e.g. ACCORD, ADVANCE) that used multiple treatment modalities to achieve glycaemic targets
- CVOTs in diabetes are event-driven with MACE as a primary endpoint
- Almost all CVOTs within diabetes are placebo-controlled, testing the addition of the medication of interest or placebo to standard of care
- Event driven – designed to accrue a predefined number of end point events (e.g. CV death); the larger the required number of events, the larger or longer the trial needs to be
- MACE is considered a more stringent end point with arguably less ambiguity and bias and more certain ascertainment than some “softer” end points.
- The type of events chosen as end points may also have a bearing on the trial size; limiting events to MACE may require more patient-years to accrue compared with a broader spectrum of qualifying events
- One exception is CAROLINA, where the sulfonylurea glimepiride is the active comparator. This design may offer an additional benefit of testing efficacy parameters of linagliptin versus glimepiride in a long-term, head-to-head comparison; however, an FDA review had raised concerns related to the unknown CV effect of glimepiride, subsequently notifying the sponsor of their requirement to conduct a CV safety study with linagliptin versus placebo
Q2 2016 – TERMINATED: NCT01703208 A Study to Assess Cardiovascular Outcomes Following Treatment With Omarigliptin (MK-3102) in Participants With Type 2 Diabetes Mellitus (MK-3102-018). “The study was terminated for business reasons and not due to any safety or efficacy concerns related to omarigliptin”
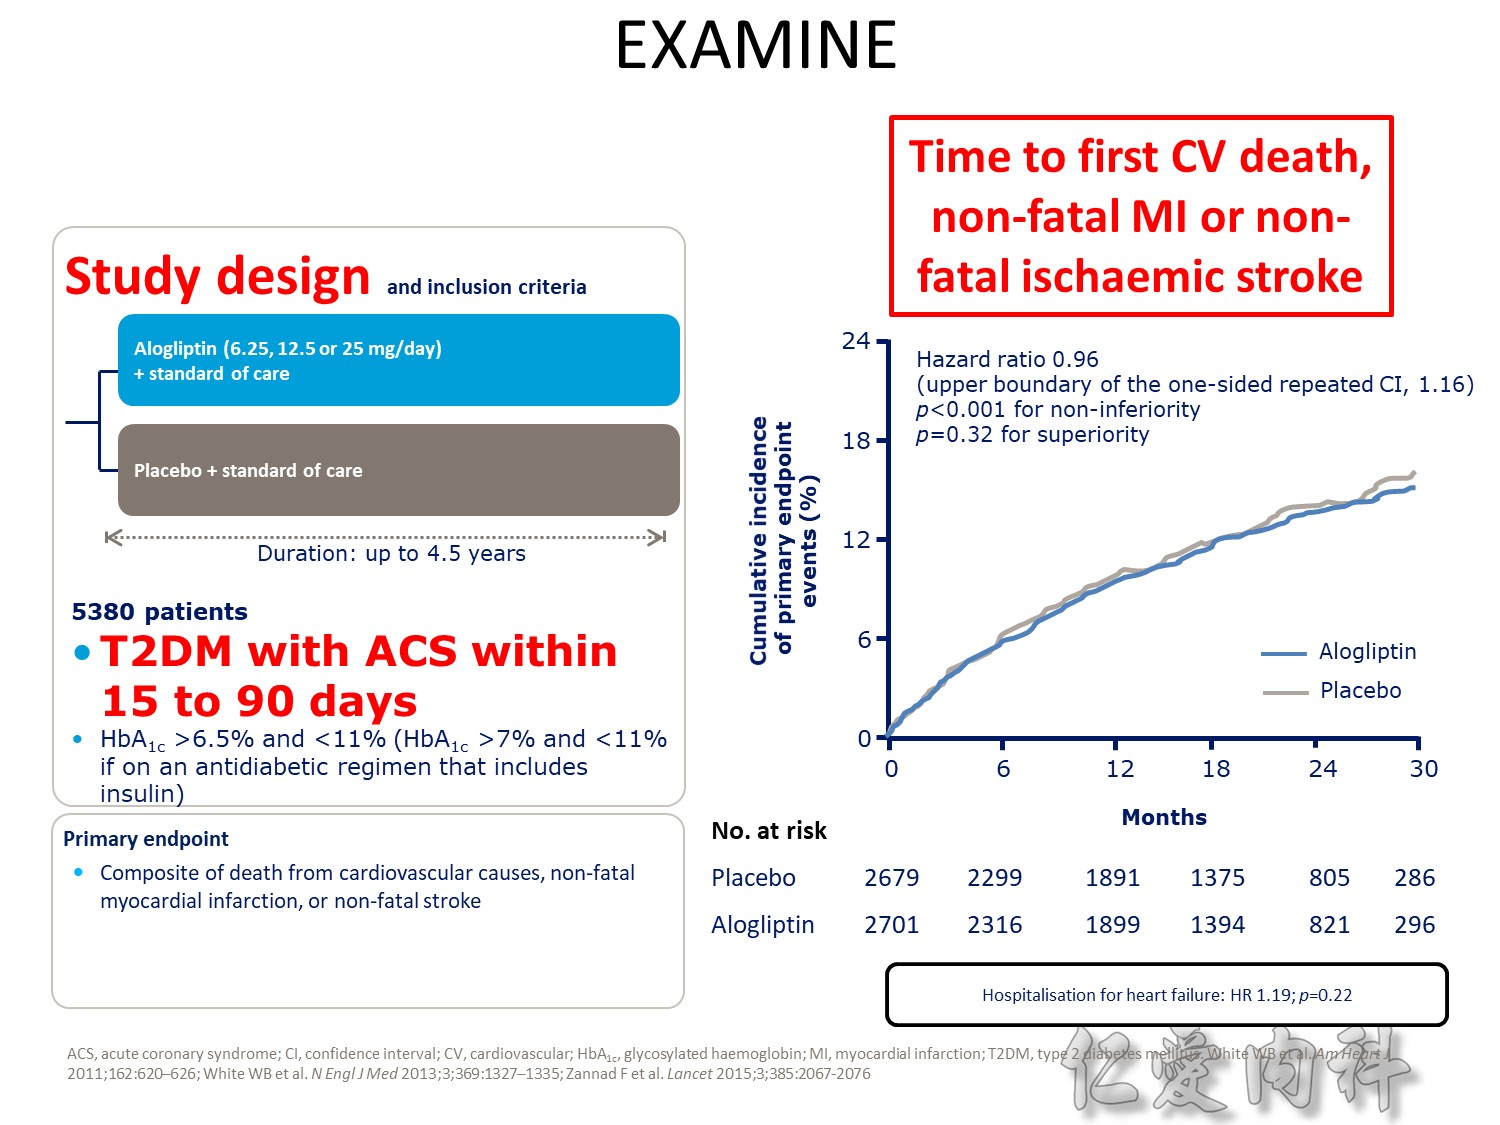
Upper boundary of the one-sided repeated CI, 1.16; P<0.001 for noninferiority; P=0.32 for superiority
Q2 2016 – TERMINATED: NCT01703208 A Study to Assess Cardiovascular Outcomes Following Treatment With Omarigliptin (MK-3102) in Participants With Type 2 Diabetes Mellitus (MK-3102-018). “The study was terminated for business reasons and not due to any safety or efficacy concerns related to omarigliptin”
The DCCT (Diabetes Control and Complications Trial) showed that intensive treatment reduced the risks of retinopathy, nephropathy, and neuropathy by 35% to 90% compared with conventional treatment.1 These risk reductions were maintained through 7 years of follow-up in EDIC (Epidemiology of Diabetes Interventions and Complications).1 Risk reductions emerged for any cardiovascular (CV) disease event (p=0.02) in EDIC for patients who had received intensive treatment in DCCT.2 Mortality did not differ between the groups and was less than expected on the basis of population-based mortality studies.1
In the UKPDS (United Kingdom Prospective Diabetes Study), relative reductions in risk associated with intensive glucose control persisted at 10 years for microvascular disease (p=0.001).3,4 Post-trial risk reductions emerged for myocardial infarction (p=0.014) and death from any cause (p=0.007).3,4
Microvascular outcomes are yet to be reported for the ACCORD (Action to Control Cardiovascular Risk in Diabetes) study. As compared with standard glucose control, intensive glucose control increased mortality (p=0.04) and did not significantly reduce major CV events.5
In ADVANCE (Action in Diabetes and Vascular Disease: Preterax and Diamicron-MR Controlled Evaluation), intensive glucose control was associated with a significant reduction (p=0.01) in the relative risk of major microvascular events. There were no significant effects of the type of glucose control on death from CV causes (p=0.12) or death from any cause (p=0.28).6
In VADT (Veterans Affairs Diabetes Trial), intensive glucose control had no significant effect on the rates of major CV events or death. The results showed that any worsening of albumin excretion was greater in the standard therapy group (p=0.05).7
DCCT/EDIC. JAMA 2002;287:2563–2569.
DCCT/EDIC. N Engl J Med 2005;353:2643–2653.
UKPDS Group. Lancet 1998;352:837–853.
Holman R, et al. N Engl J Med 2008;359:1577–1589.
ACCORD Study Group. N Engl J Med 2008;358:2545–2559.
ADVANCE Collaborative Group. N Engl J Med 2008;358:2560–2572.
Duckworth W, et al. N Engl J Med 2009;360:129–139.


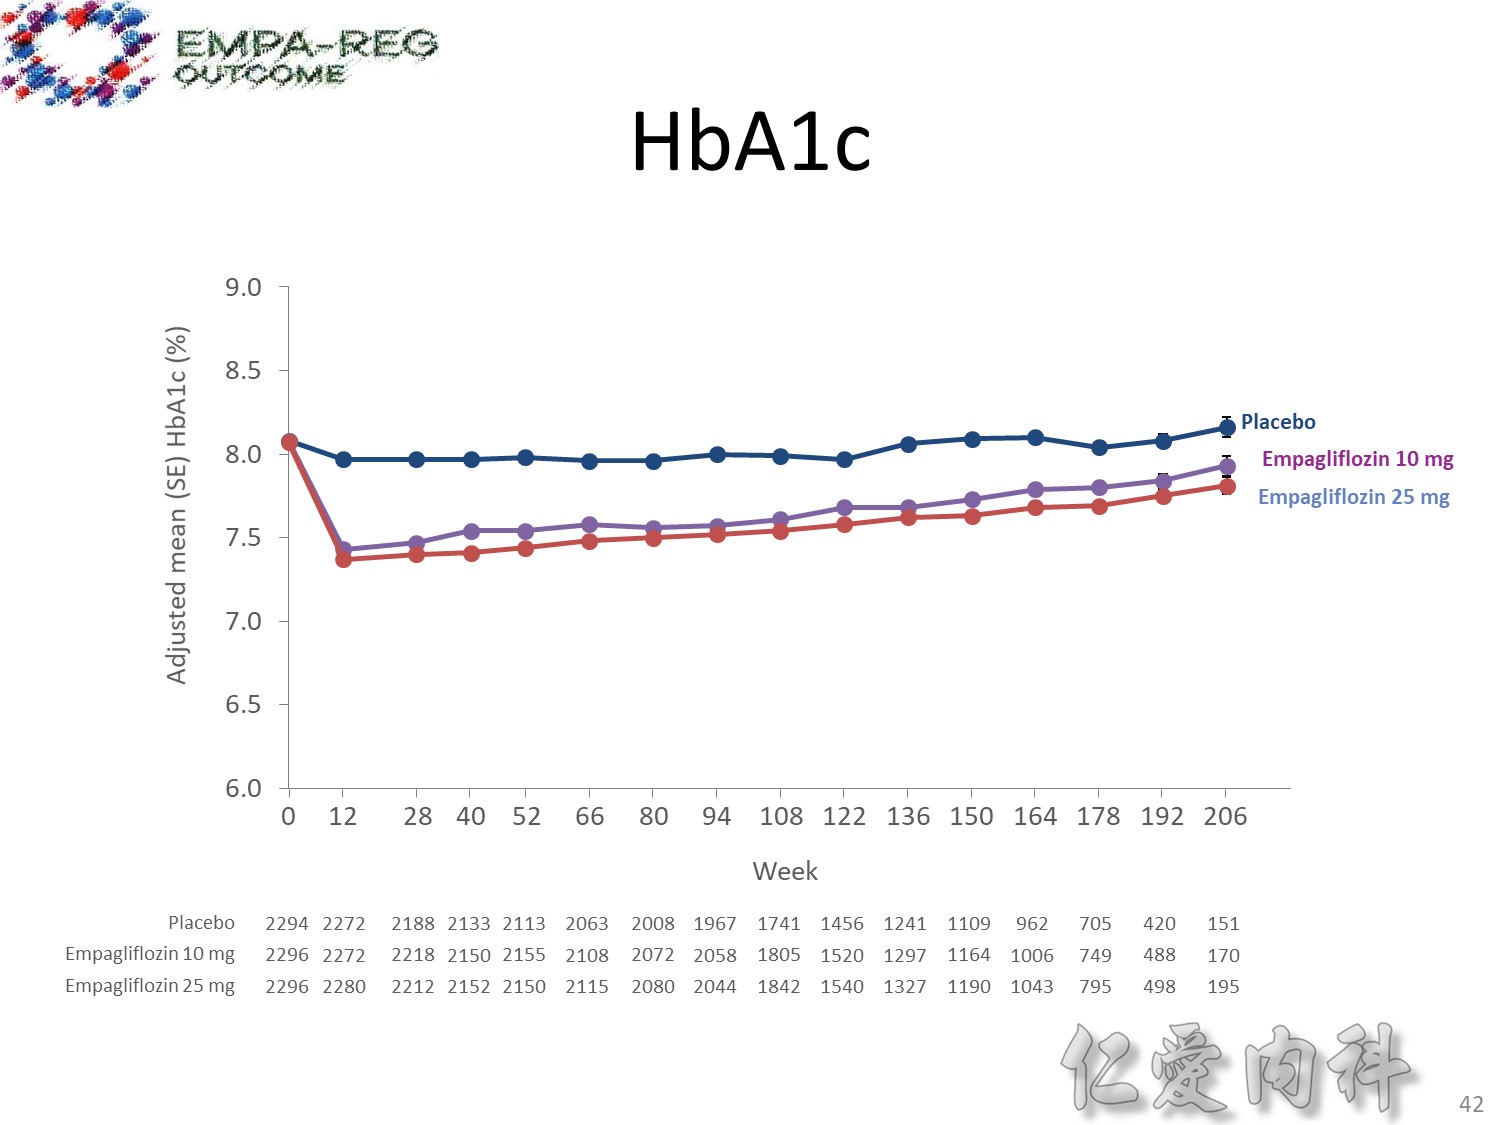
1245_0025final–01-1502–study-report-body. Table 15.2.4.3.1.3: 1 HbA1c (%) change from baseline MMRM results over time − FAS (OC−AD)
Table 15.2.4.1.1: 1
Table 15.2.4.1.2: 1
Table 15.2.4.1.3: 1
Table 15.2.4.1.5: 1
Table 15.2.4.1.8: 1
Table 15.2.4.1.9: 1
Reference: Primary manuscript Table 1

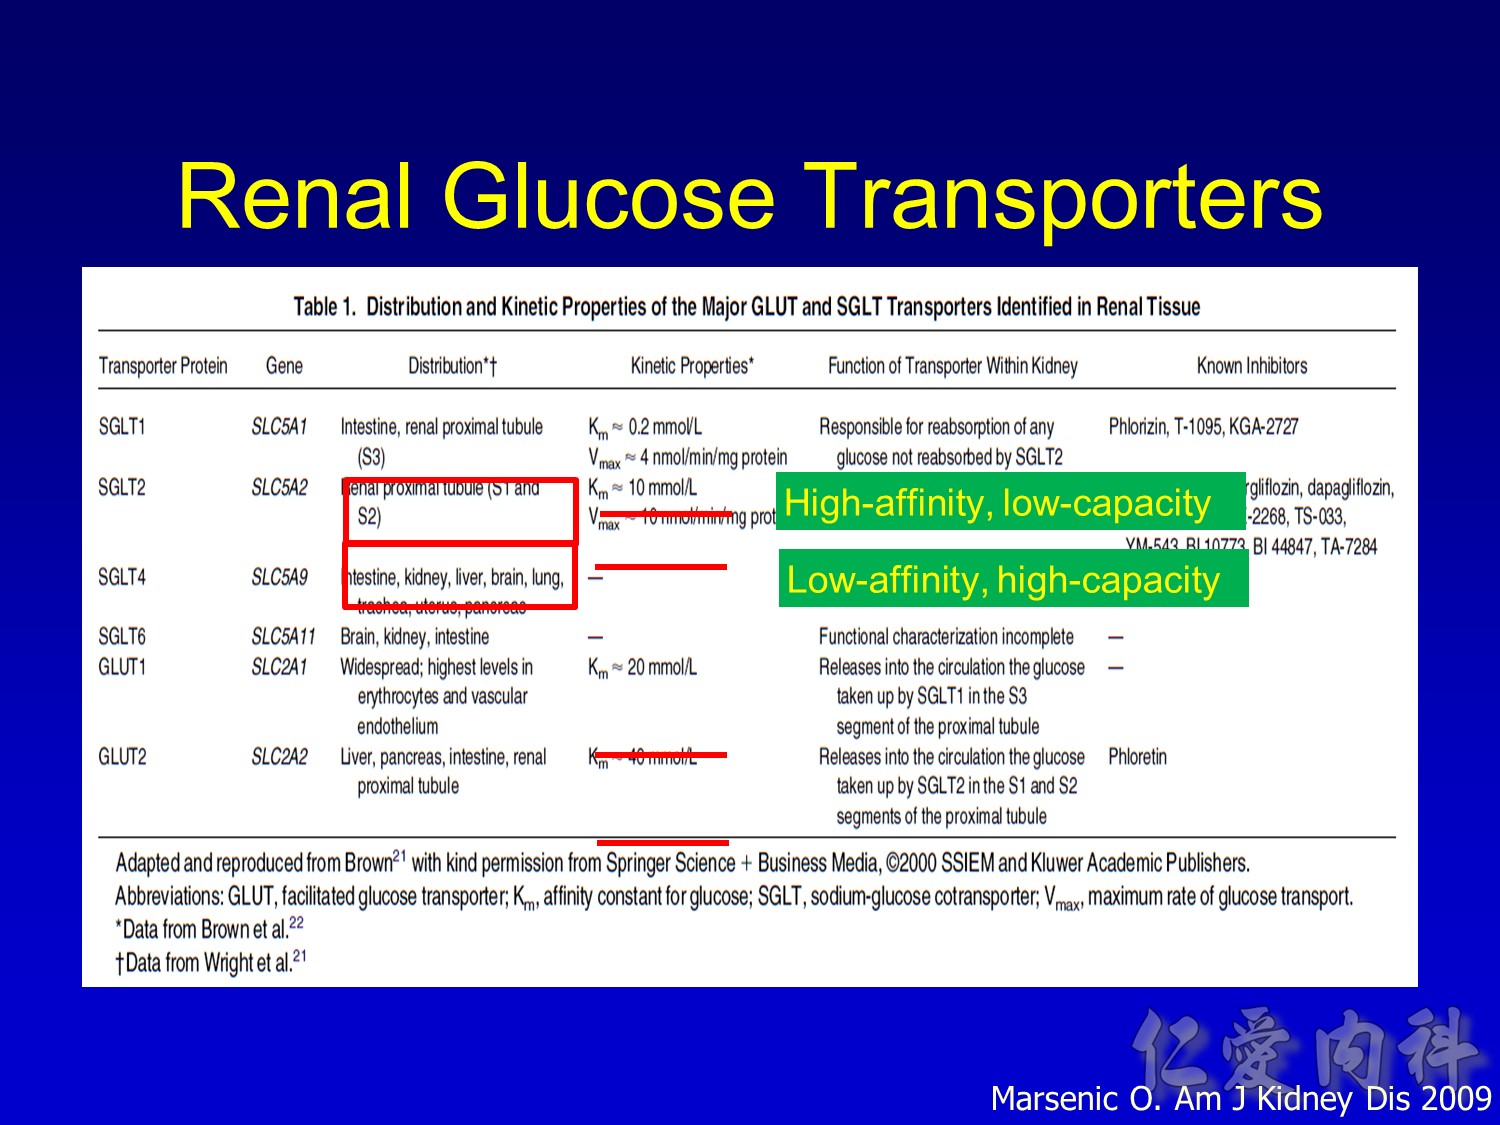
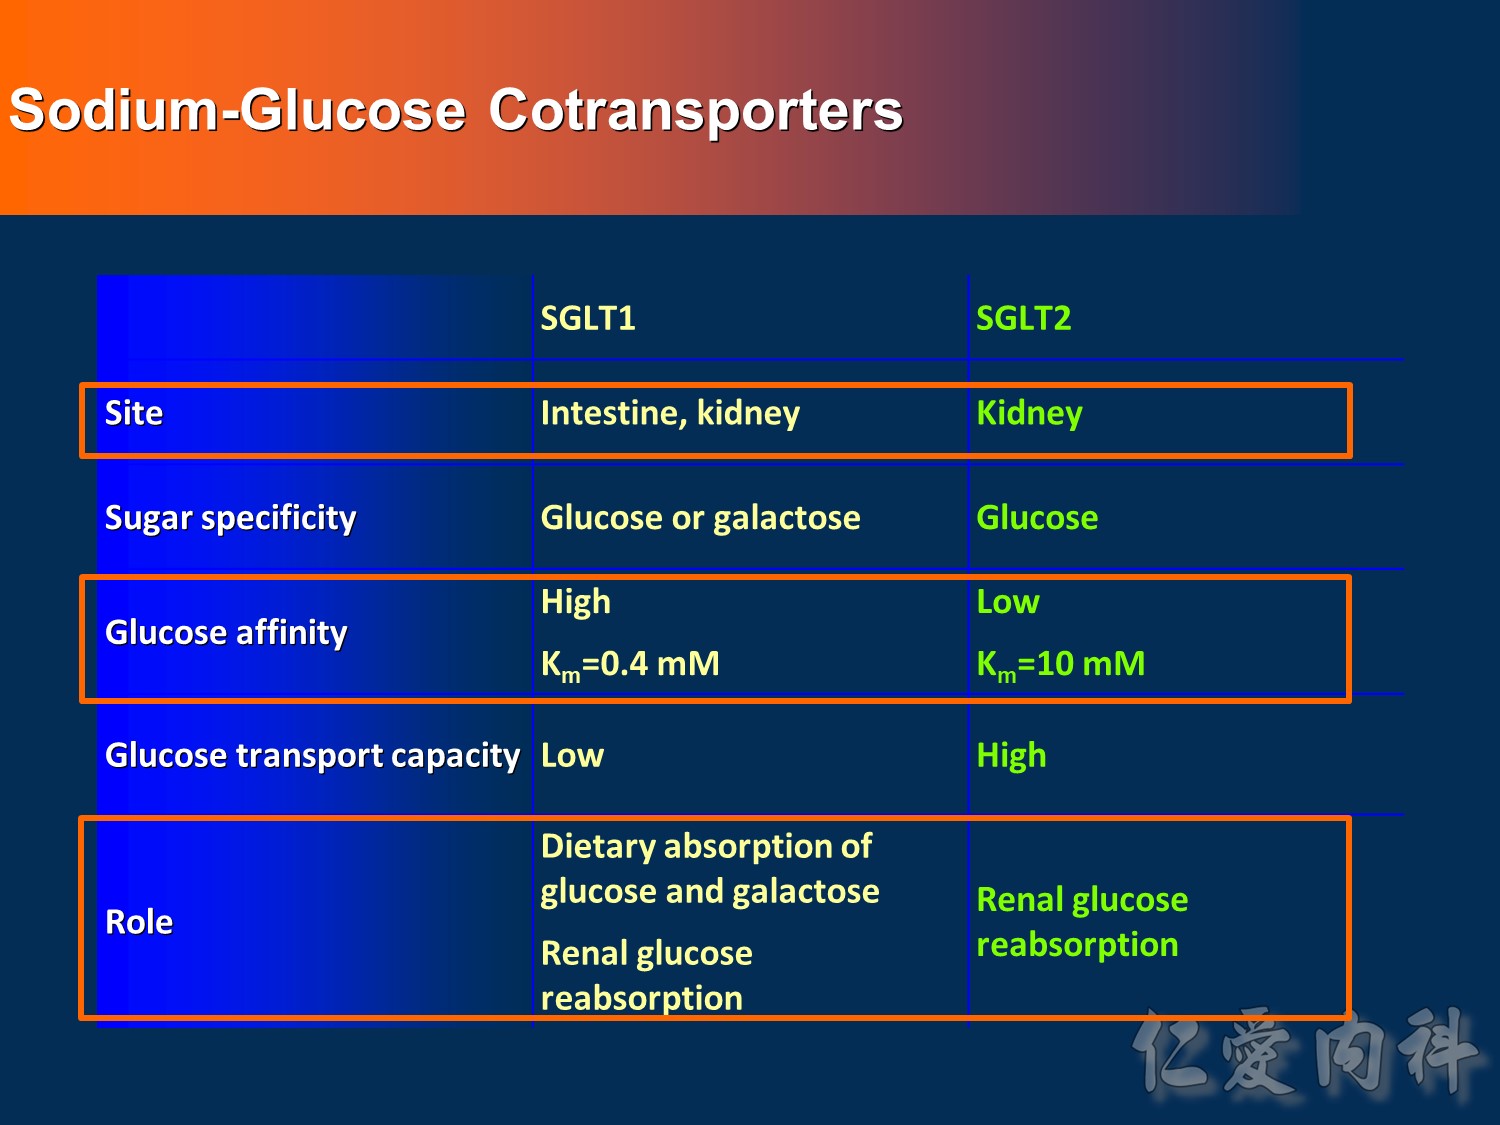
- This slide describes the differences between the 2 sodium-glucose transport proteins.
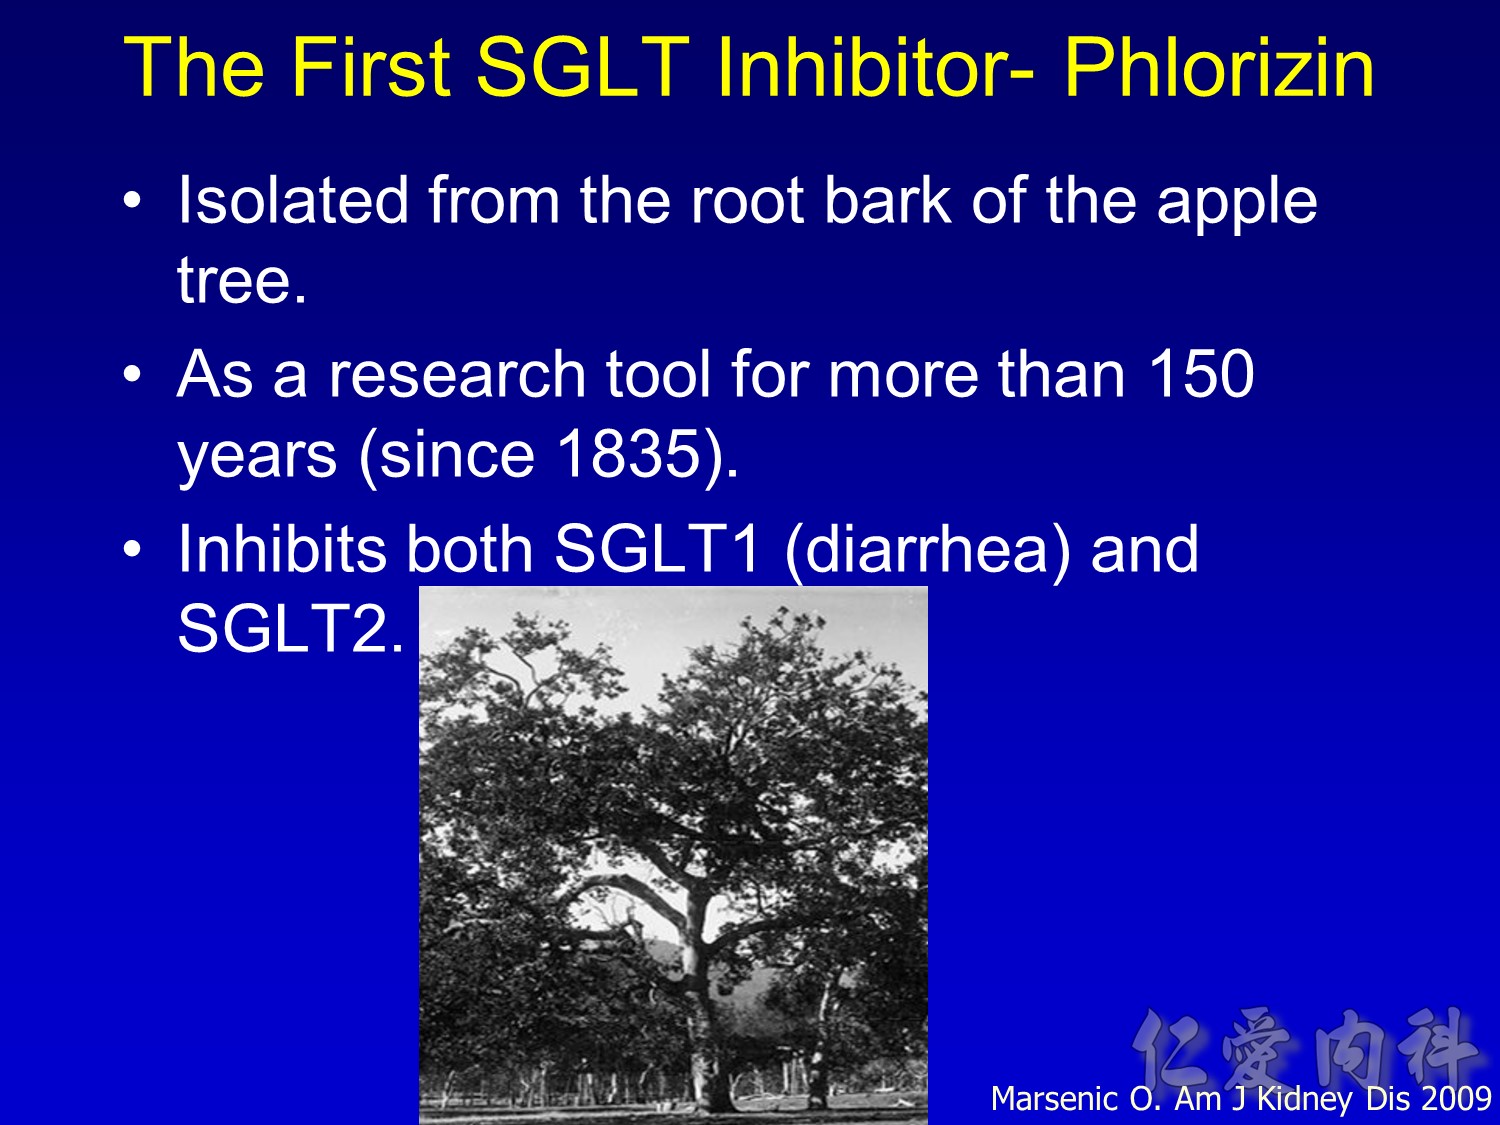
- SGLT1 is a high-affinity, low-capacity transport protein that resides in both the gut and the proximal tubule in the kidney. It plays a role in both dietary absorption and renal reabsorption of glucose. Inhibition of SGLT1 can result in malabsorption of glucose and other nutrients from the intestine, leading to osmotic diarrhea. For example, in glucose-galactose malabsorption syndrome, mutations in the gene for SGLT1 result in impaired absorption of glucose and galactose and severe diarrhea. Individuals with this condition must receive all carbohydrates in the form of fructose, or malnutrition and even death may result.
- In contrast, SGLT2 is a low-affinity, high-capacity transport protein that resides in the proximal tubule alone. Specific inhibition of SGLT2 as a rational target of therapy for type 2 diabetes is based on familial renal glucosuria. Patients with this benign, inherited condition have a defective SGLT2 protein and excrete large amounts of glucose in their urine, with few if any adverse effects, as shall be discussed in later slides.
Wright EM, Hirayama BA, Loo DF. Active sugar transport in health and disease. J Intern Med. 2007;261:32-43.
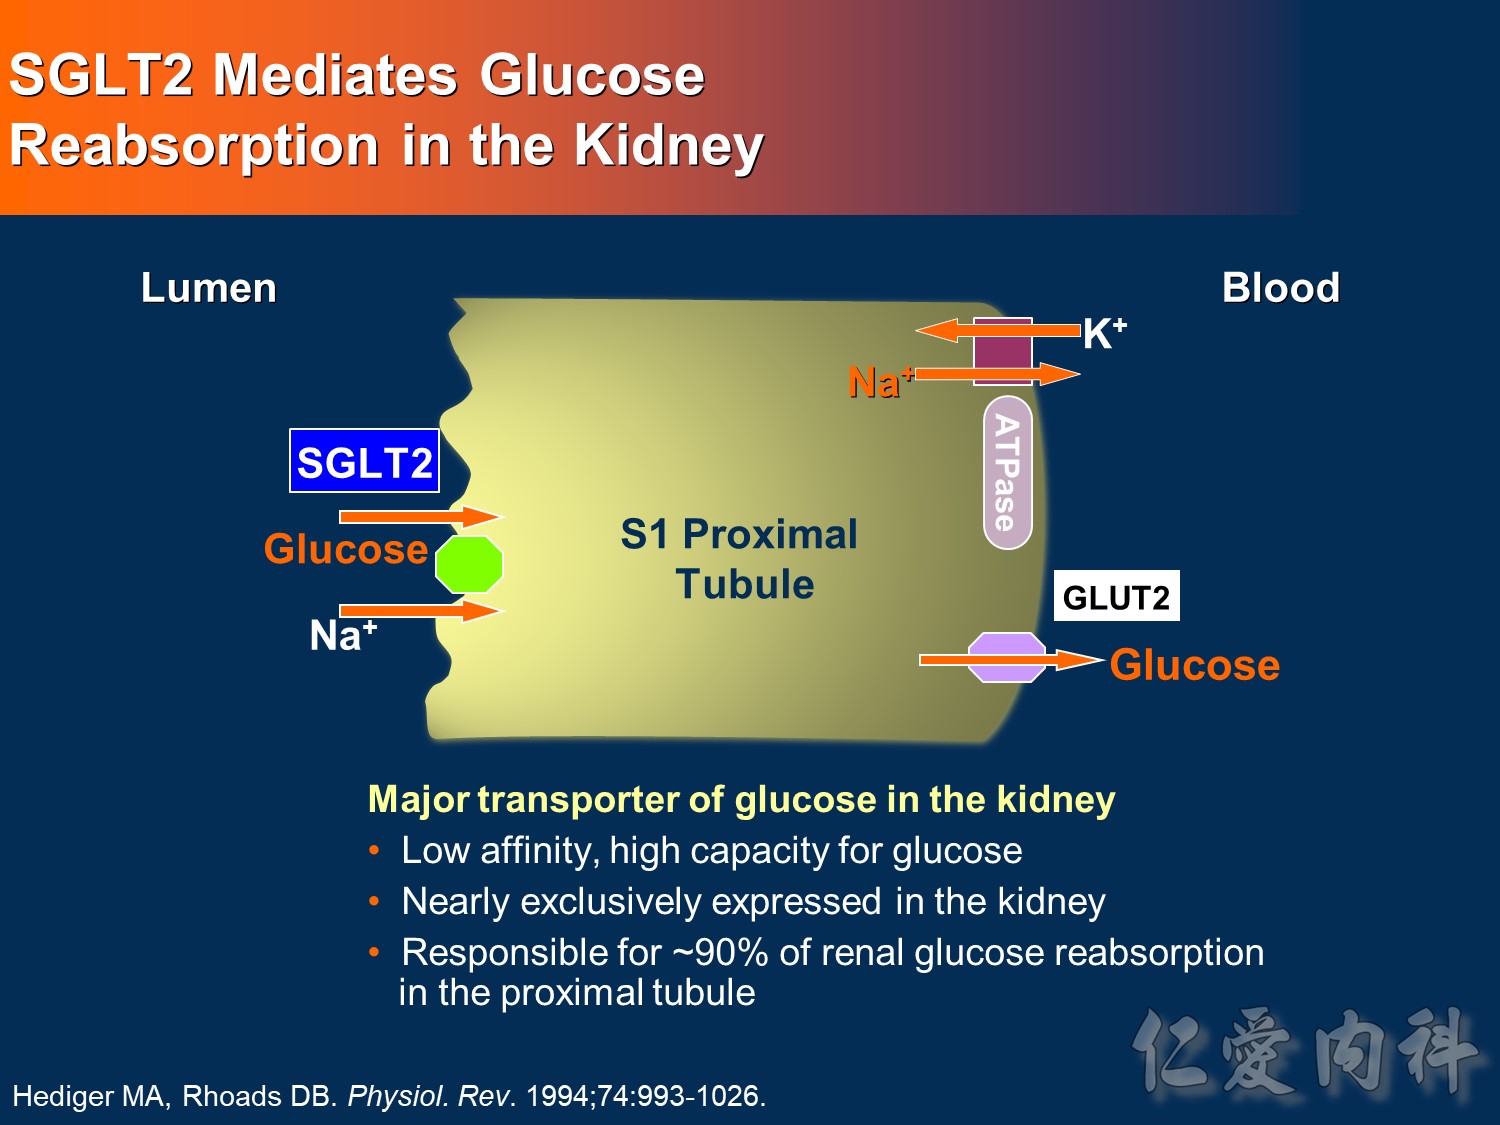
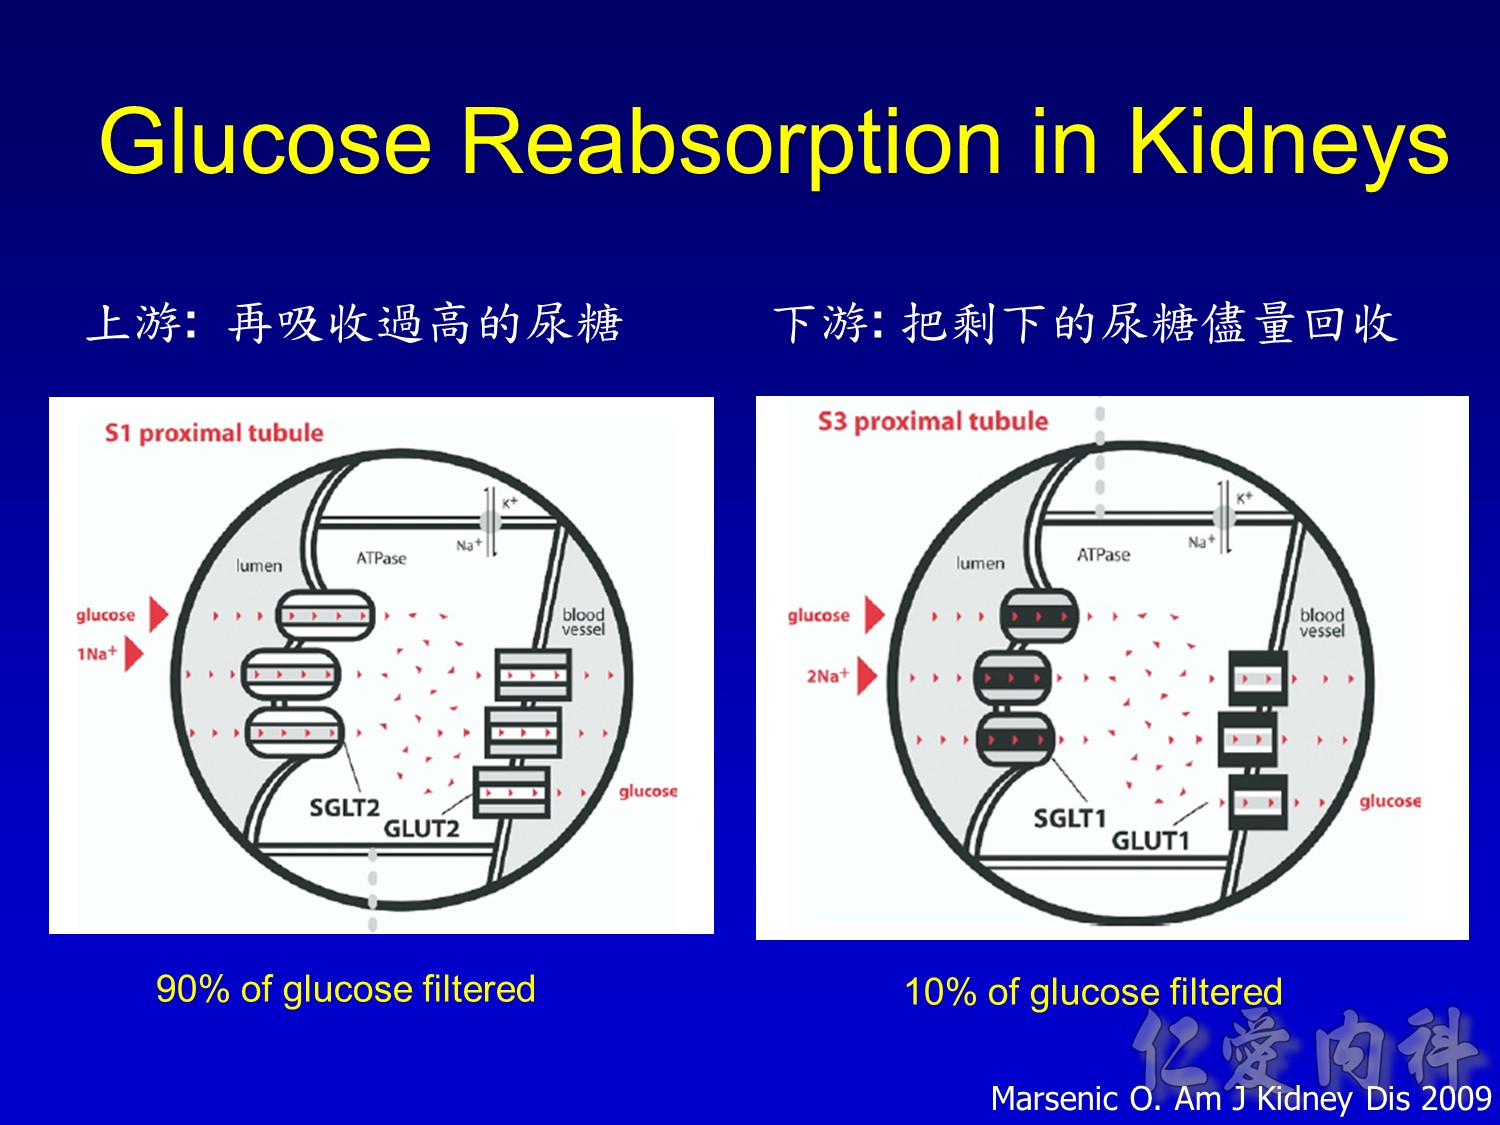
- This slide shows the basic mechanism of SGLT2. On the luminal side of the early proximal tubule S1 segment, absorption of sodium across the cell membrane creates an energy gradient that in turn allows glucose to be absorbed. On the other side of the cell, sodium is reabsorbed through an ATPase-mediated sodium-potassium pump into the bloodstream in order to maintain intravascular volume. This exchange alters the concentration gradient within the cell so that glucose is reabsorbed into the bloodstream via the GLUT2 transporter.
- The GLUT2 transporter is present in red blood cells, the brain, and other tissues and thus is not a candidate for pharmacologic intervention. In contrast, SGLT2 is specific to the proximal tubule, so that pharmacologic inhibition will affect glucose reabsorption in the kidney but not in other tissues.
Hediger MA, Rhoads DB. Molecular physiology of sodium-glucose cotransporters. Physiol Rev. 1994;74:993-1026.
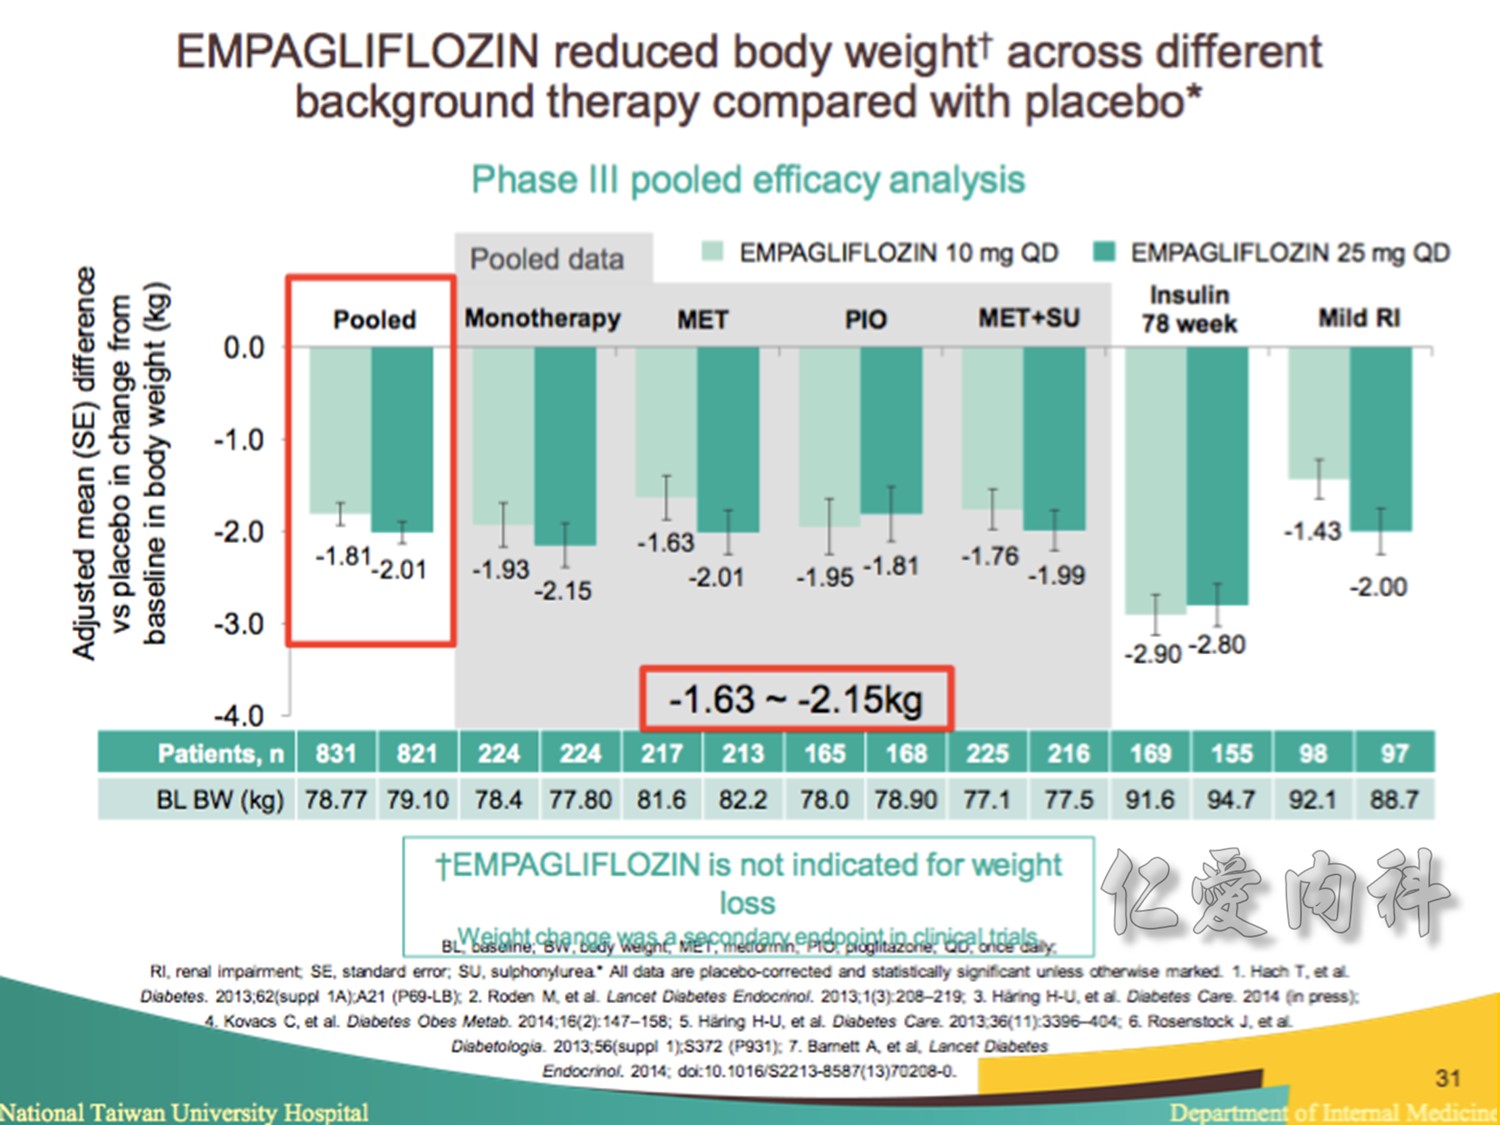
Note to speakers: this slide has been build to communicate the efficacy of EMPAGLIFLOZIN across different therapeutic scenarios. Therefore, when presenting this slide it should be highlighted that EMPAGLIFLOZIN provides clinically meaningful reductions in body weight across a number of different background therapies. A thorough description of the individual studies is not recommended.
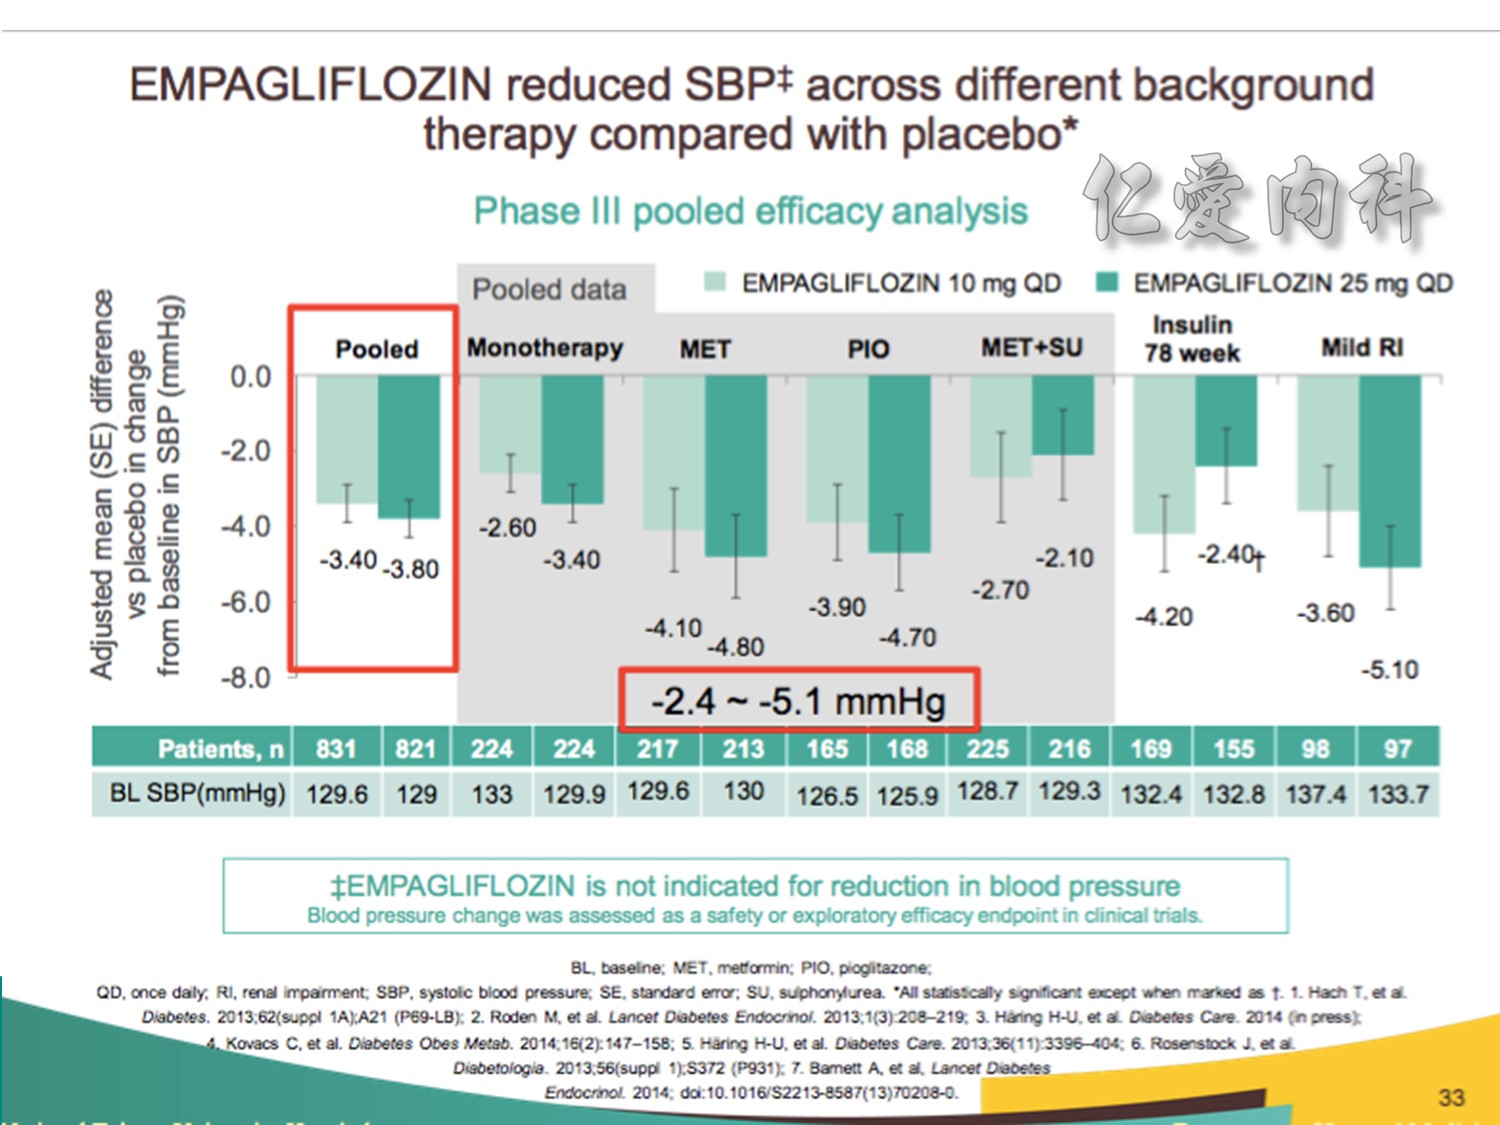
Note to speakers: this slide has been build to communicate the efficacy of EMPAGLIFLOZIN across different therapeutic scenarios. Therefore, when presenting this slide it should be highlighted that EMPAGLIFLOZIN provides clinically meaningful reductions in SBP across a number of different background therapies. A thorough description of the individual studies is not recommended.
Speaker notes
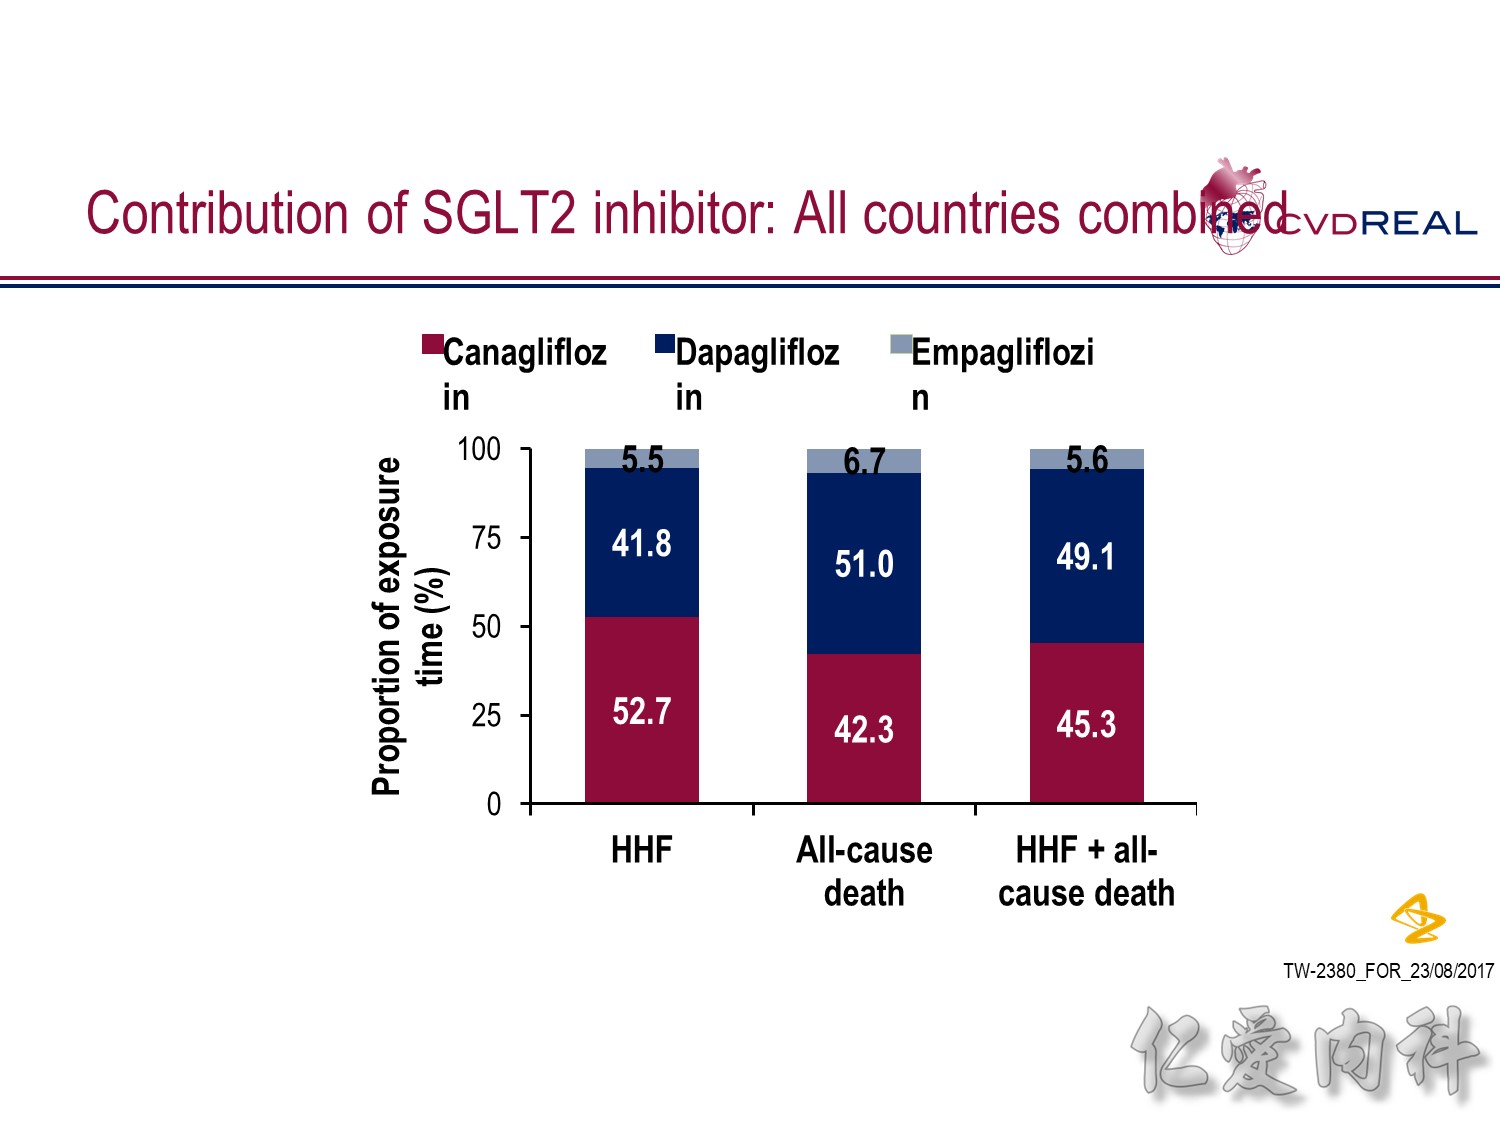
- In terms of total exposure time to SGLT2i:
- In the HHF analysis: 52.7% was accounted for by canagliflozin, 41.8% by dapagliflozin, and 5.5% by empagliflozin
- In the all-cause death analysis: 42.3% was accounted for by canagliflozin, 51.0% by dapagliflozin, and 6.7% by empagliflozin
- In the HHF + all-cause death analysis: 45.3% was accounted for by canagliflozin, 49.1% by dapagliflozin, and 5.6% by empagliflozin
Abbreviations
HHF, hospitalization for heart failure
SGLT2, sodium–glucose cotransporter-2
Speaker notes:
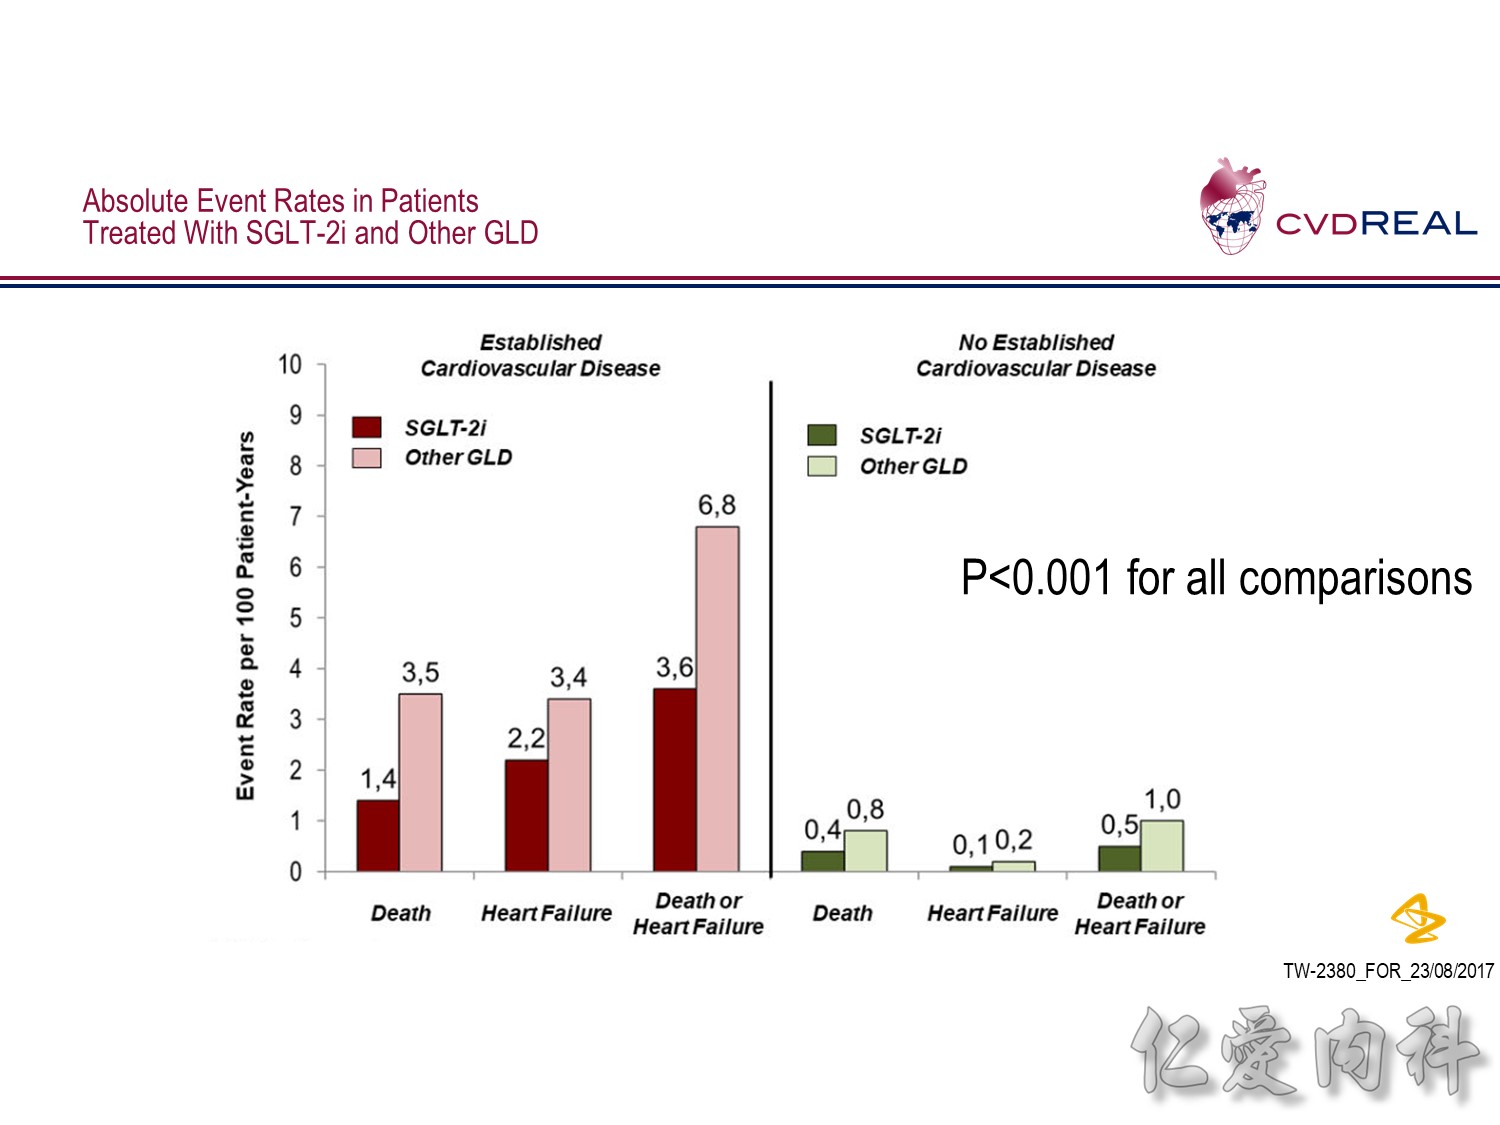
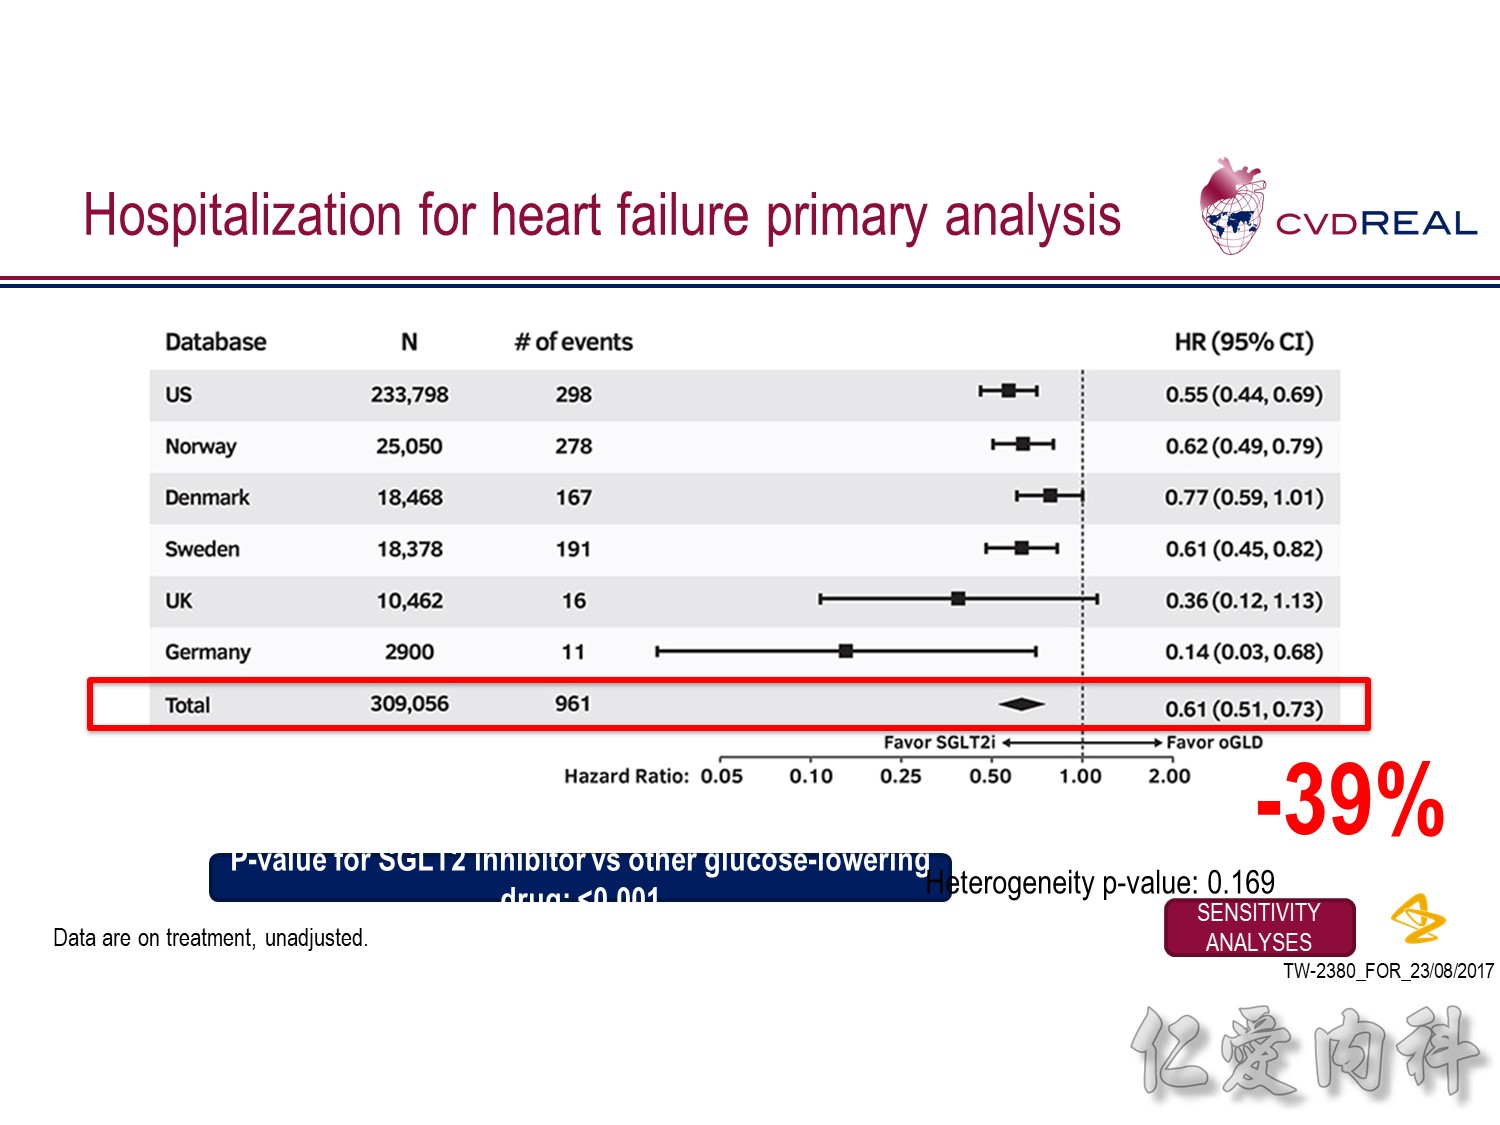
- For the outcome of hospitalization for heart failure, a total of 309,056 patients were included
- Over 190,164 person-years of follow up, there were 961 events, representing an incidence rate of 0.51/100 person-years
- Mean duration of follow up for HHF was 239 days in the SGLT2 inhibitor group and 211 days in the other glucose-lowering drug group
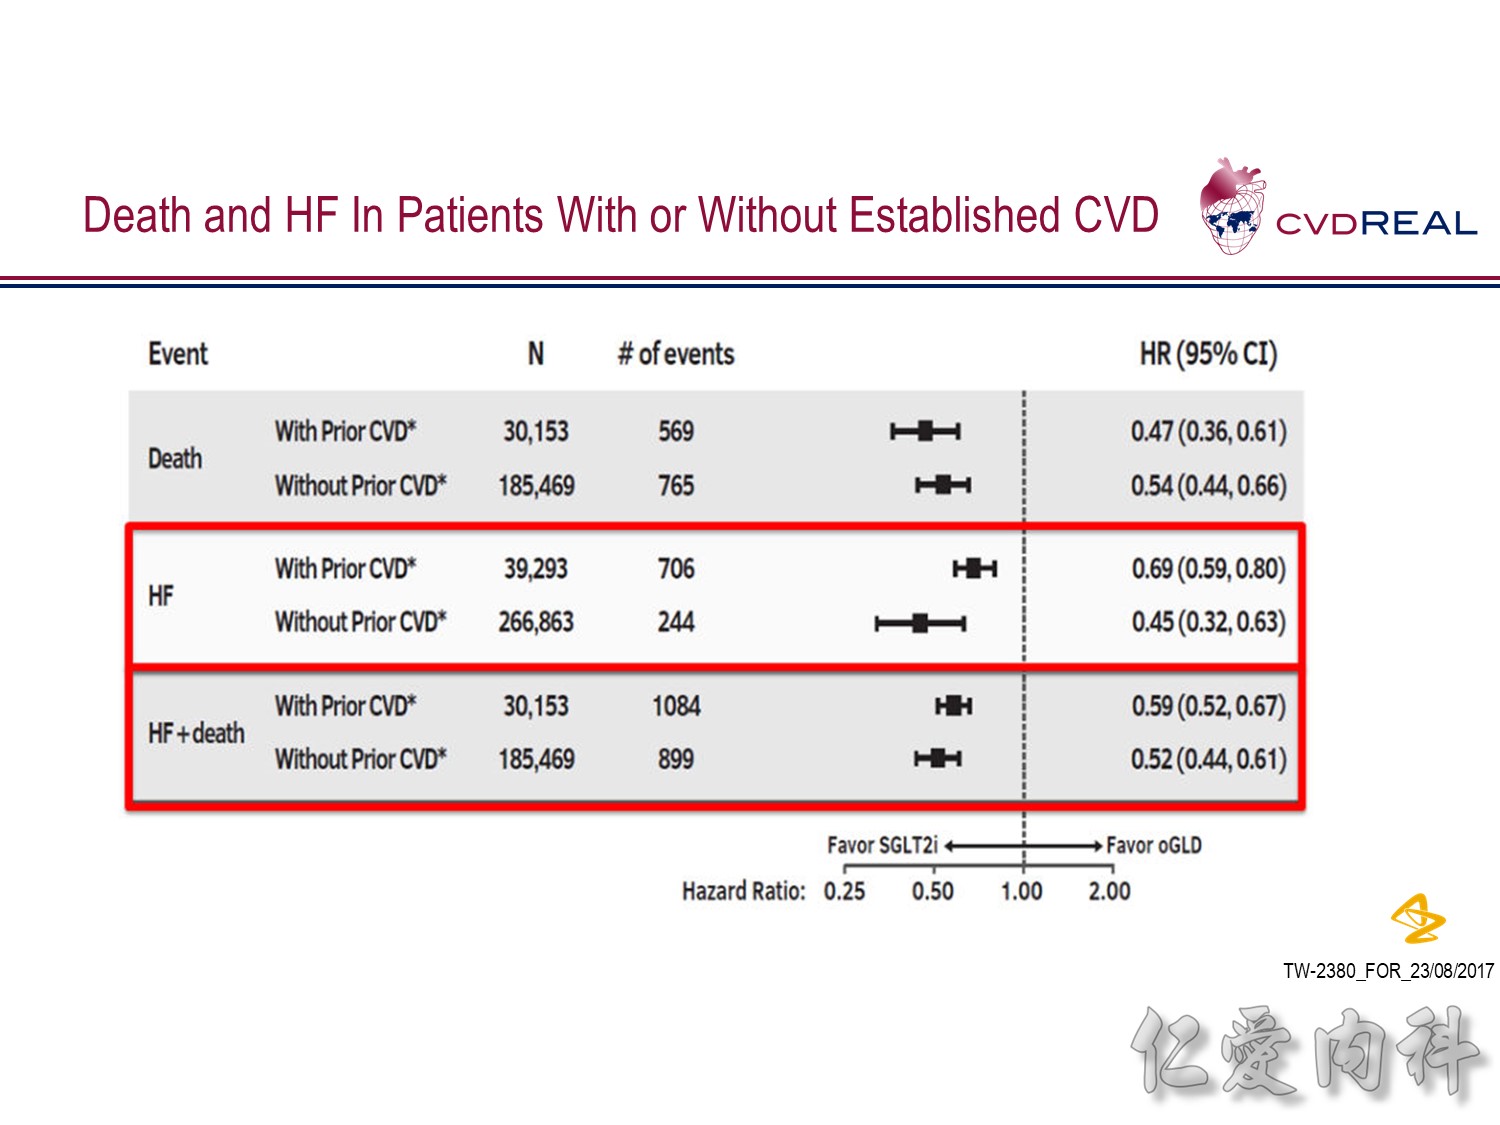
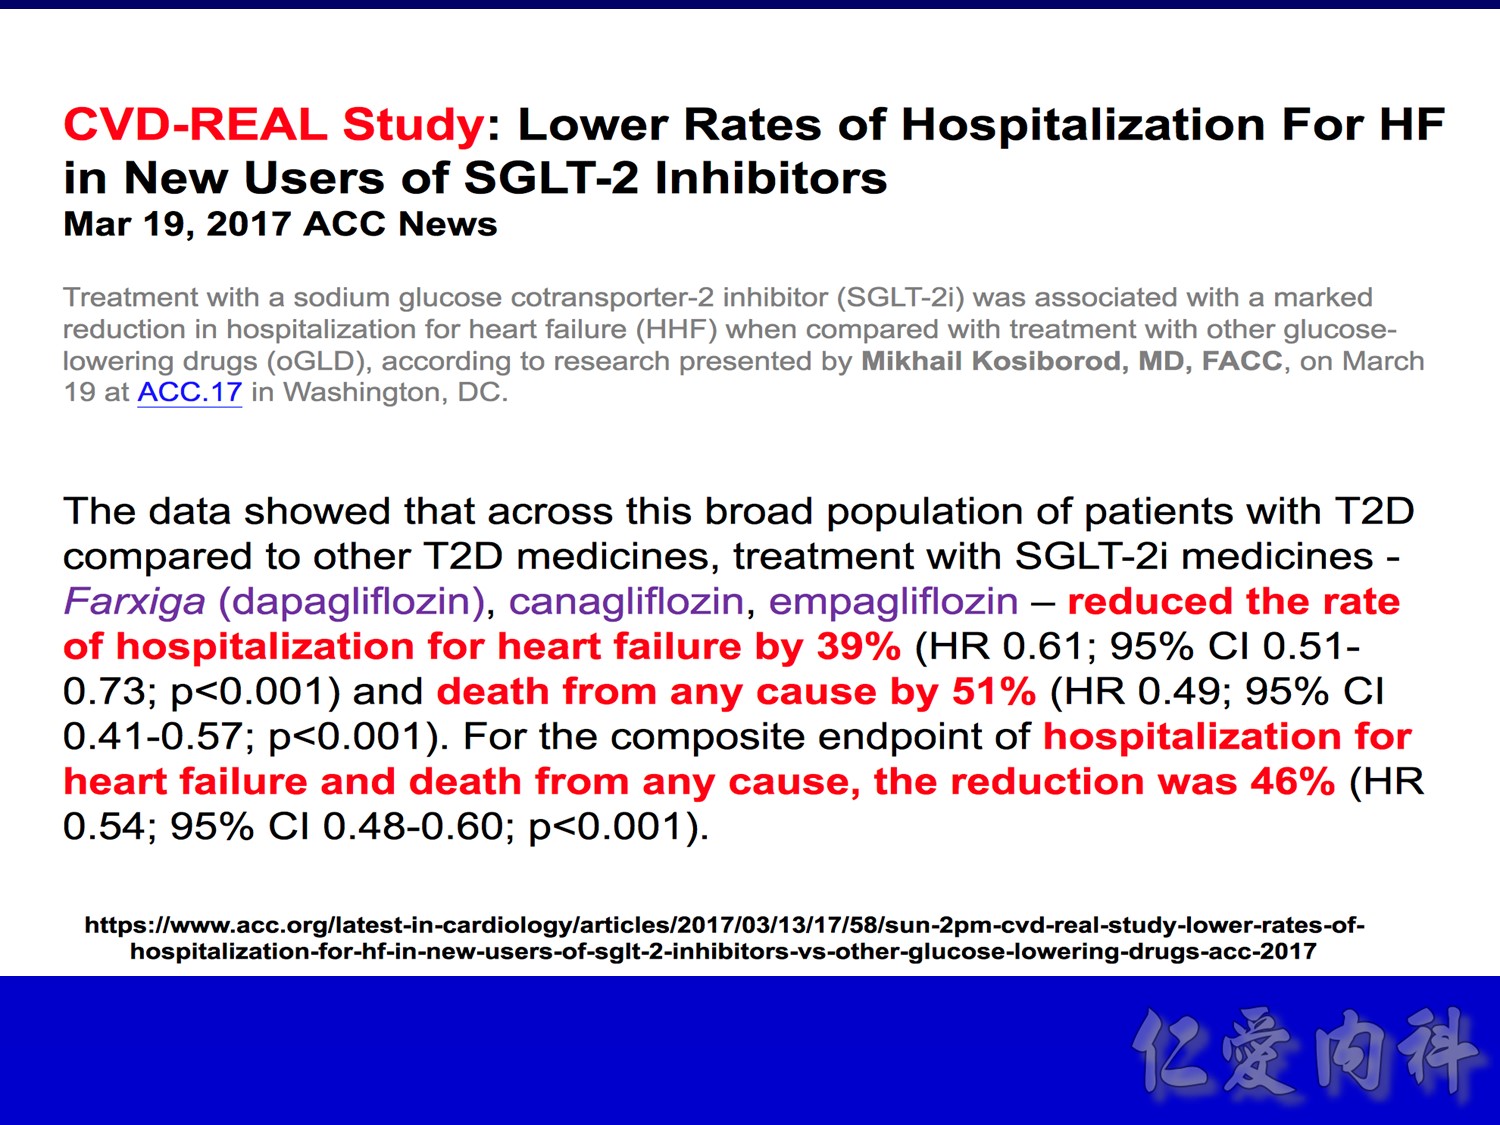
- Overall, initiation of an SGLT2 inhibitor rather than any other glucose-lowering drug was associated with a significantly lower risk of hospitalization for heart failure with a HR 0.61 (95% CI 0.51, 0.73; p-value <0.001)
- Point estimates favoured initiation of an SGLT2 inhibitor in all six of the databases investigated (Heterogeneity p-value=0.169)
Click button to view sensitivity analyses
Abbreviations
CI, confidence interval
HHF, hospitalization for heart failure
oGLD, other glucose-lowering drug
SGLT2, sodium–glucose cotransporter-2
SGLT2i, sodium–glucose cotransporter-2 inhibitor
Speaker notes:
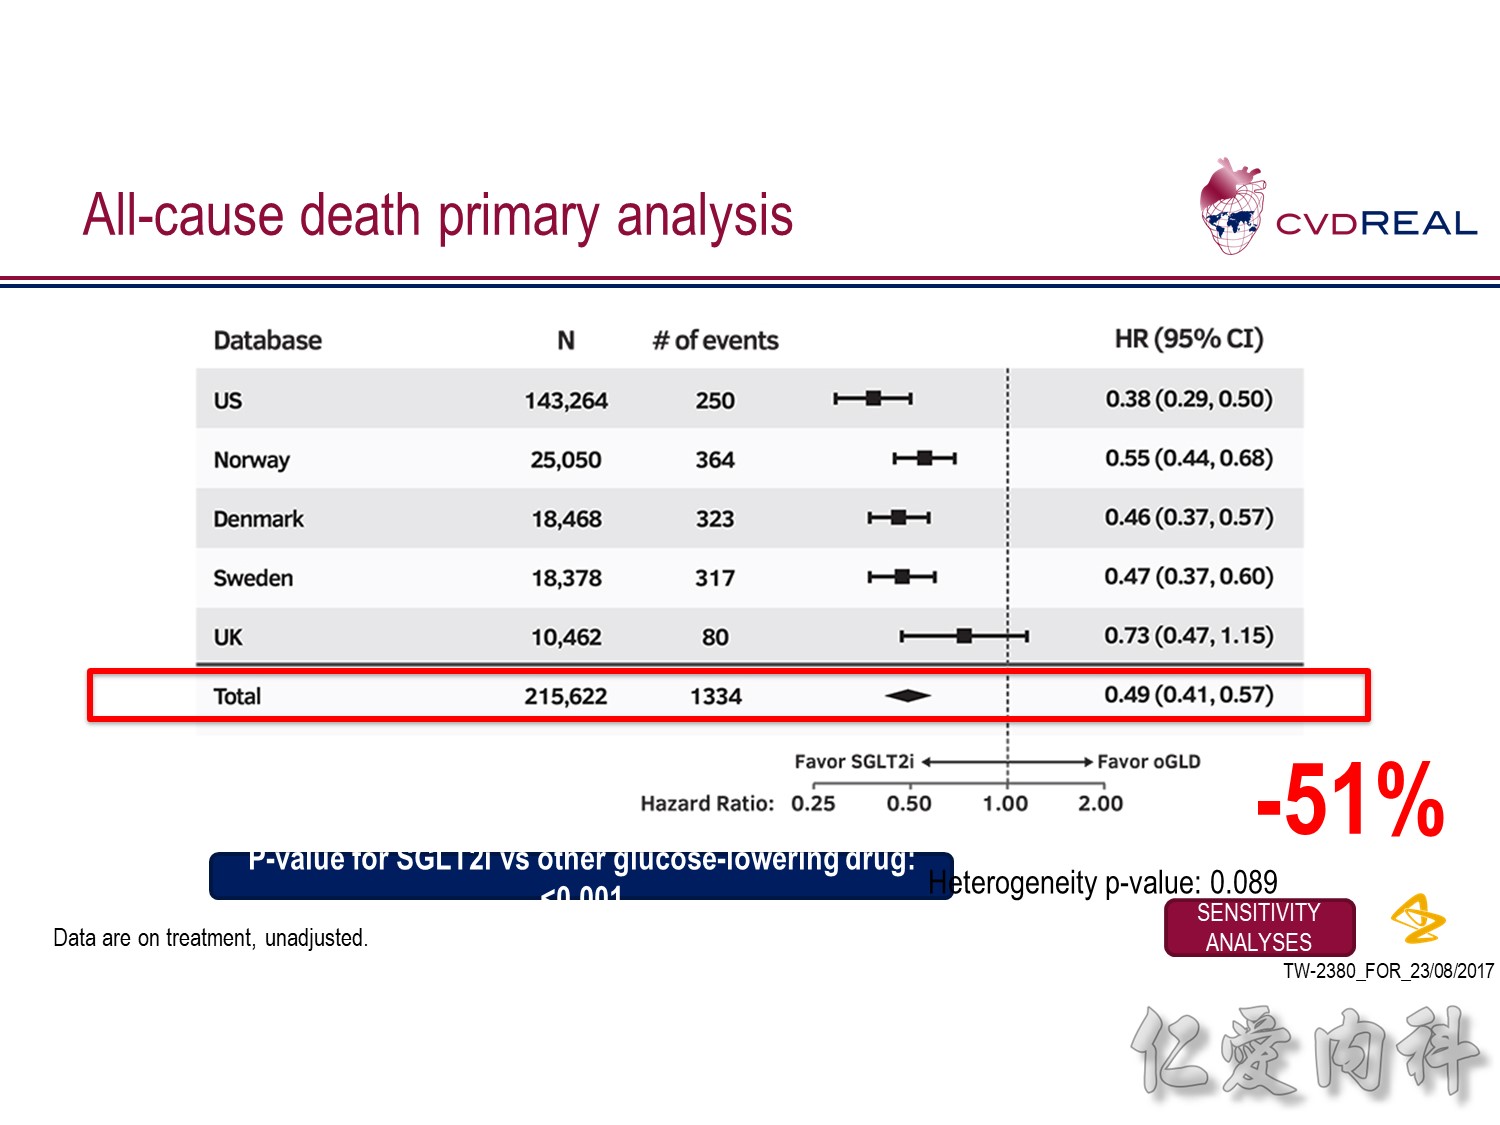
- This analysis did not include Germany as data for all-cause death were not available from the DPV database
- For the outcome of all-cause death, a total of 215,622 patients were included
- Over 153,990 person-years of follow up, there were 1334 events, representing an incidence rate of 0.87/100 person-years
- Mean duration of follow up was 271 days in the SGLT-2i group and 251 days in the other glucose-lowering drug group
- Overall, initiation of an SGLT2 inhibitor rather than any other glucose-lowering drug was associated with a significantly lower risk of all-cause death with a HR 0.49 (95% CI 0.41, 0.57; p-value <0.001)
- Point estimates favoured initiation of an SGLT2 inhibitor in all five of the databases investigated (Heterogeneity p-value=0.089)
Click button to view sensitivity analyses
Abbreviations
CI, confidence interval
HR, hazard ratio
oGLD, other glucose-lowering drug
SGLT2, sodium–glucose cotransporter-2
SGLT2i, sodium–glucose cotransporter-2 inhibitor