

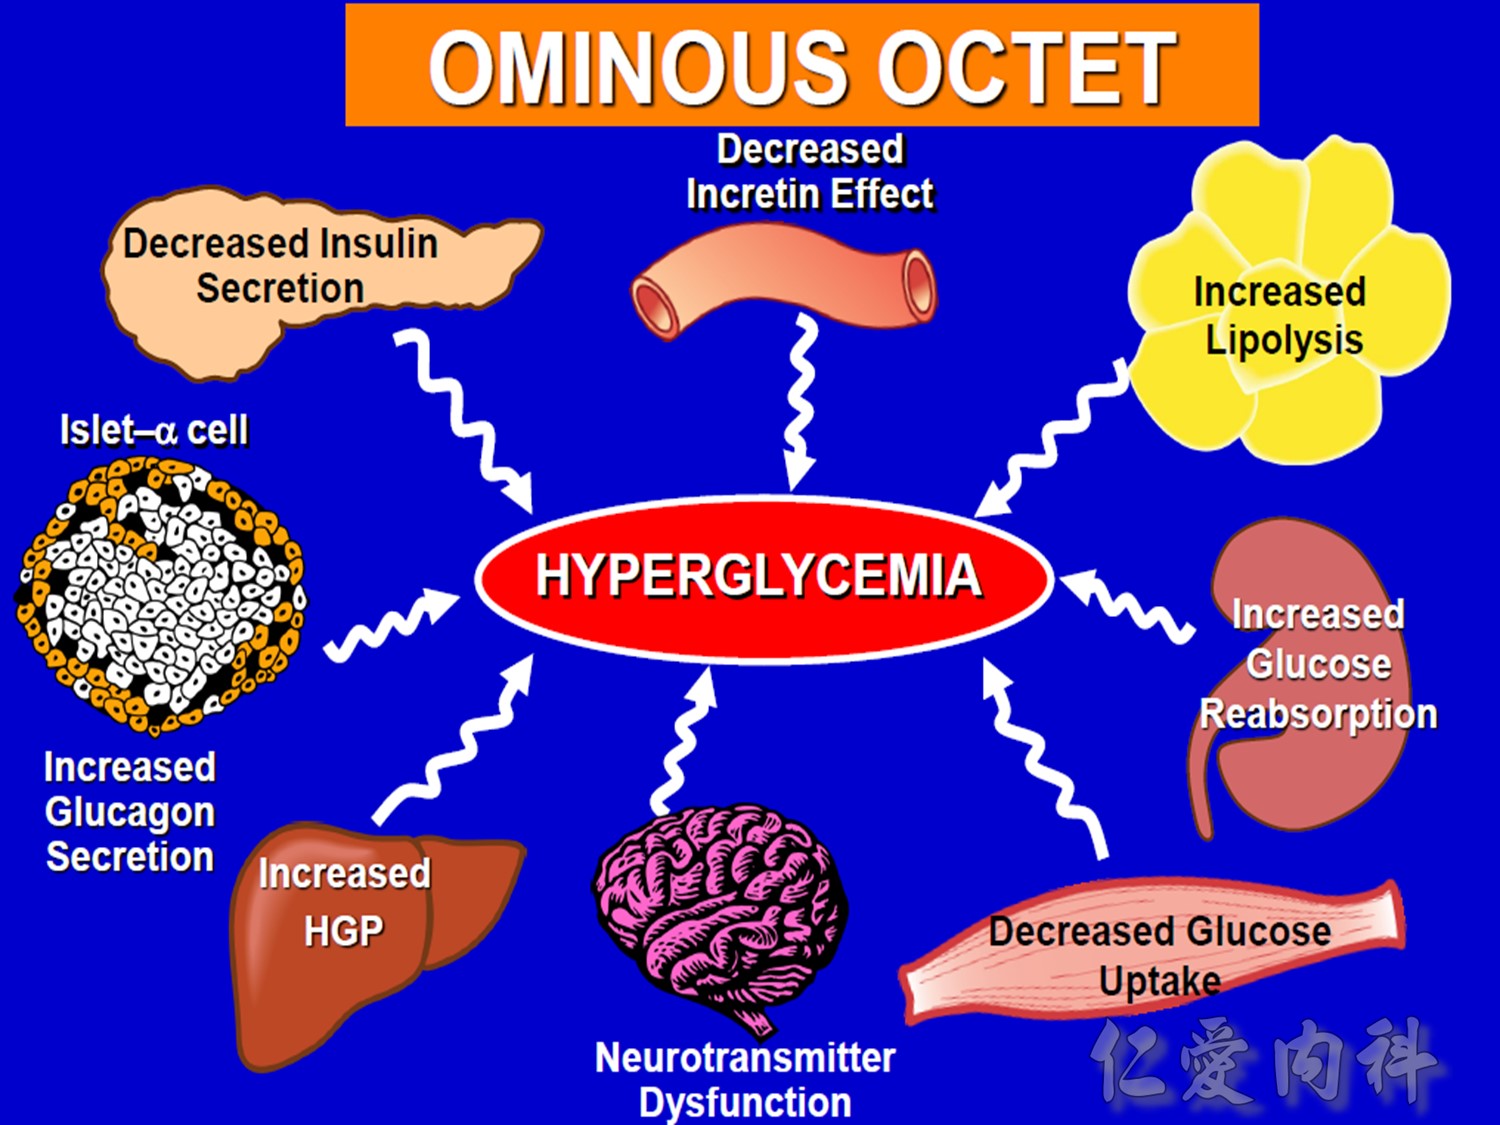
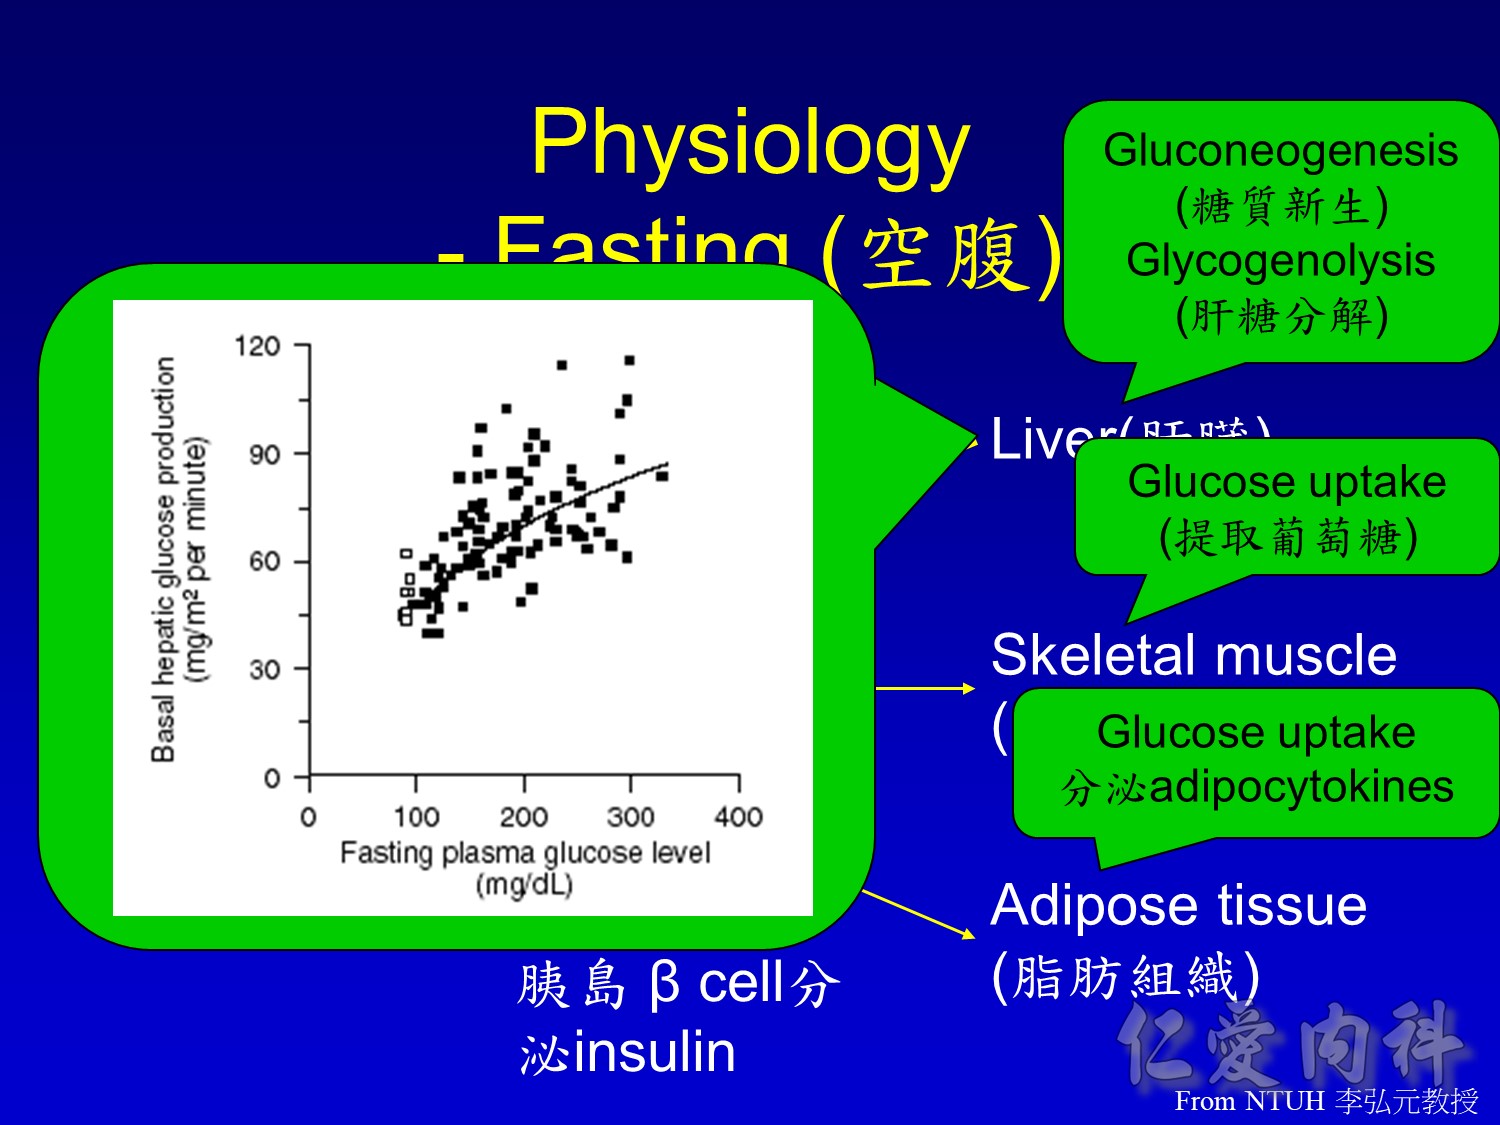
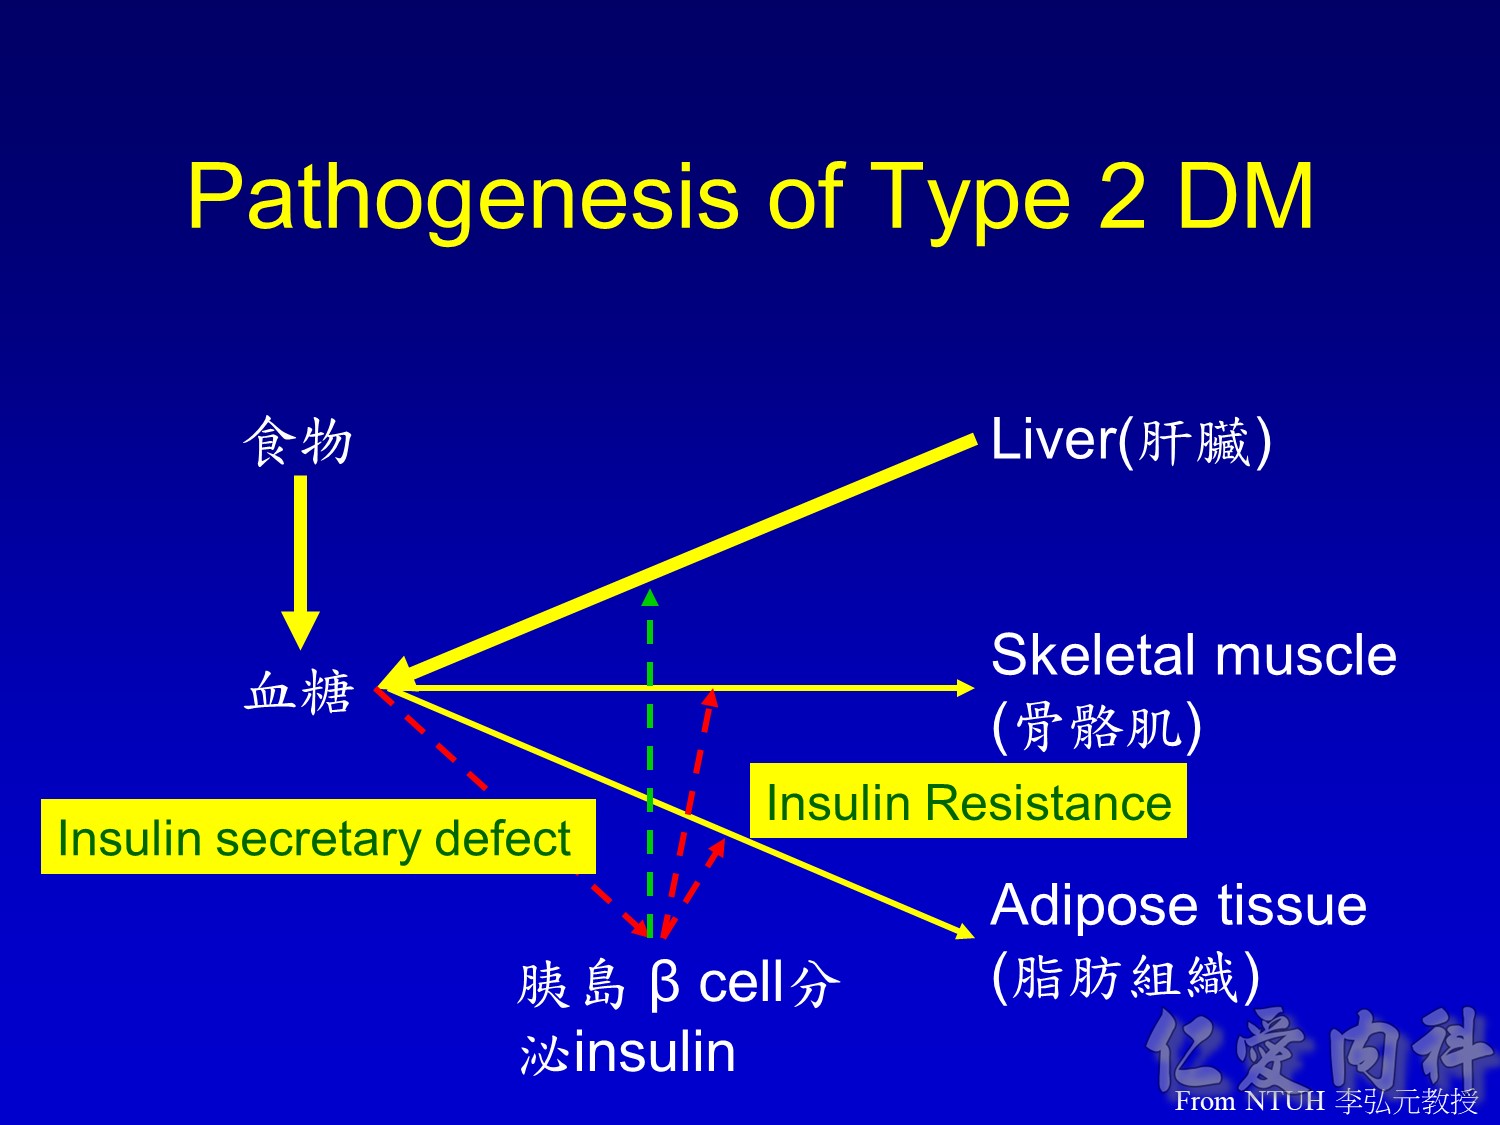
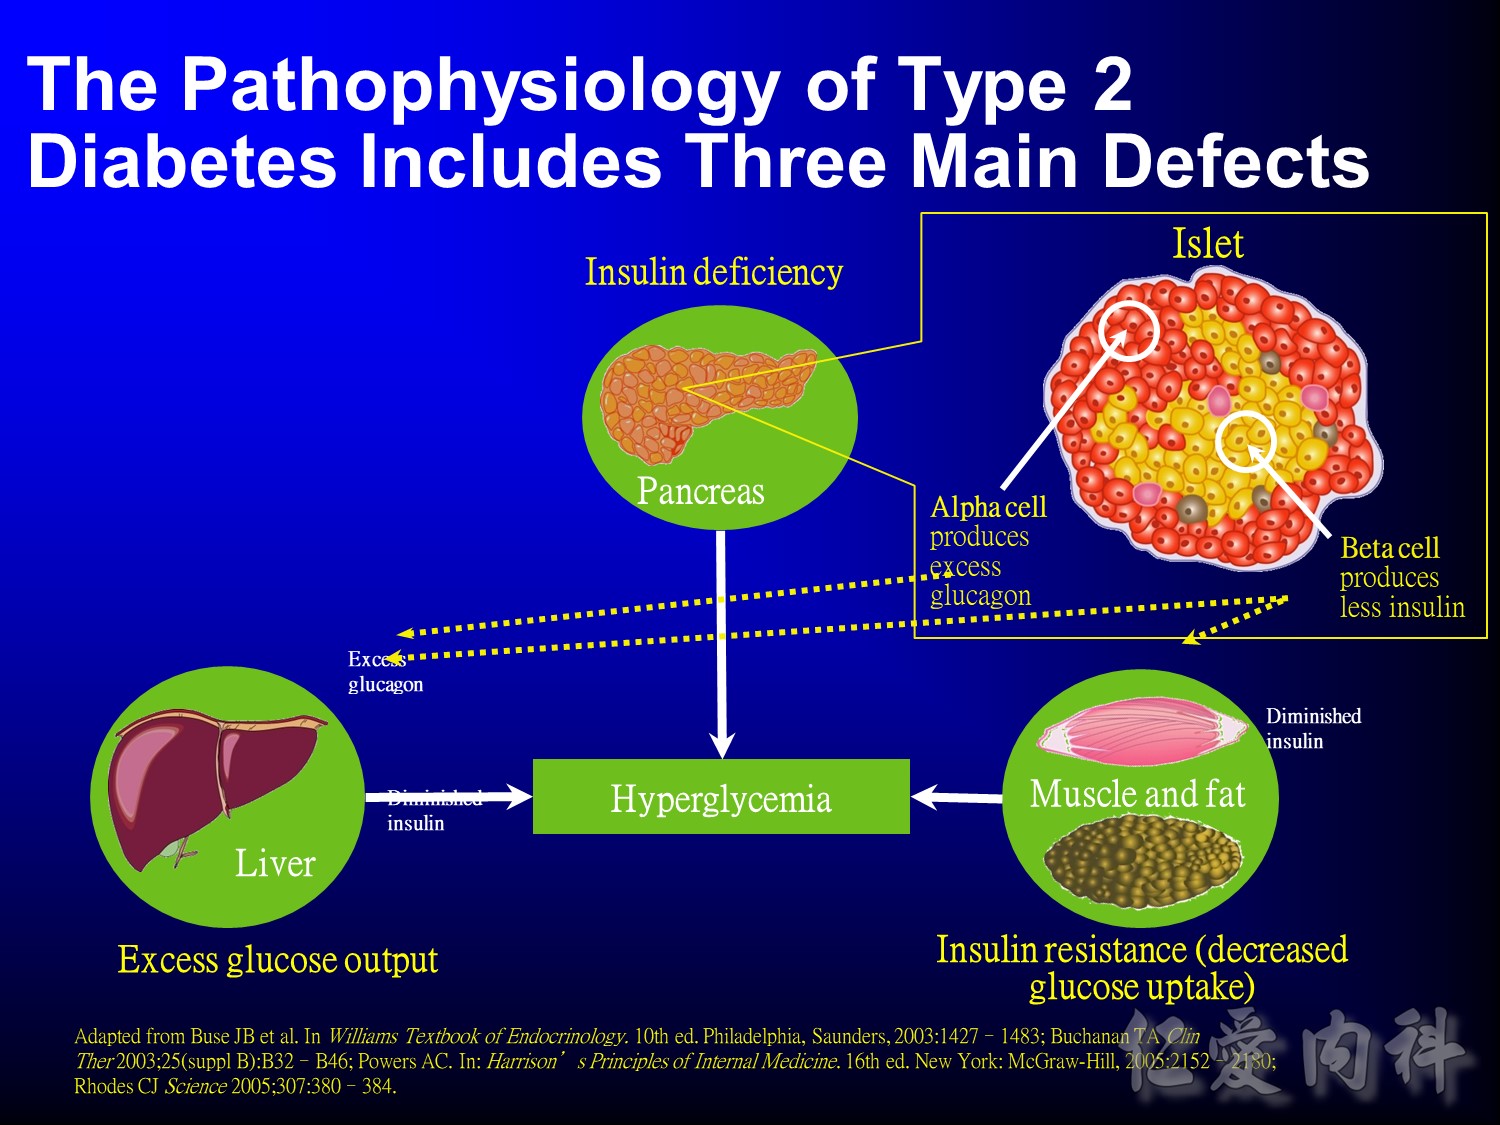
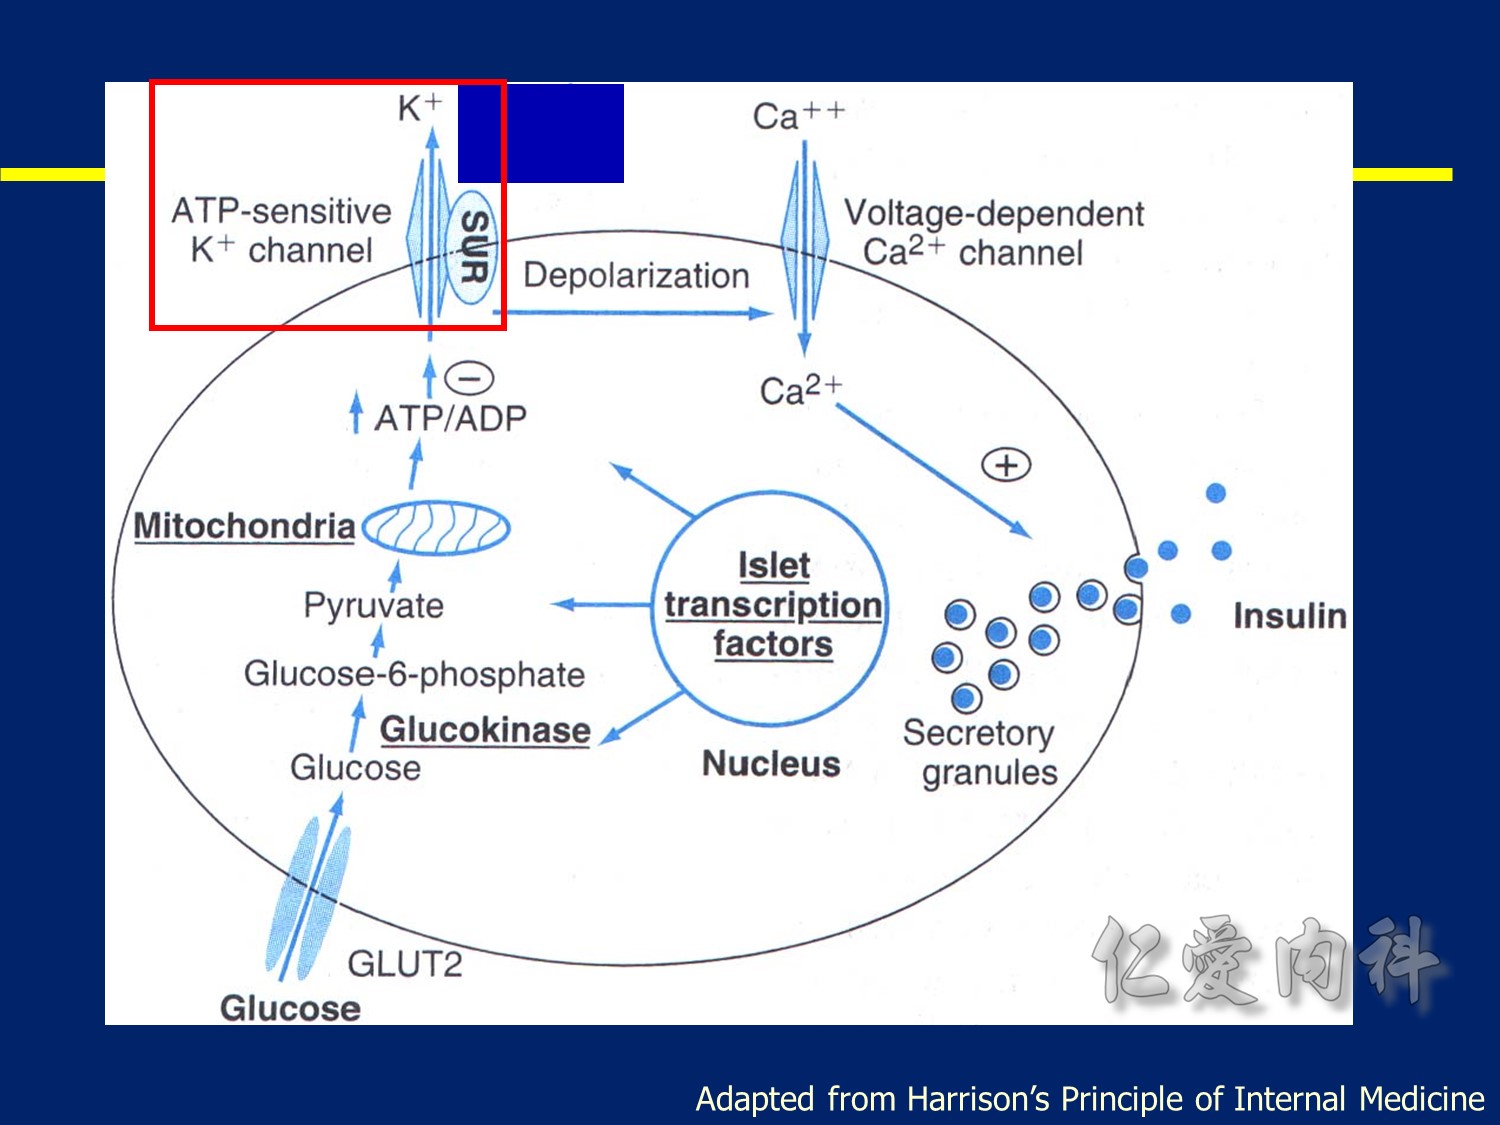
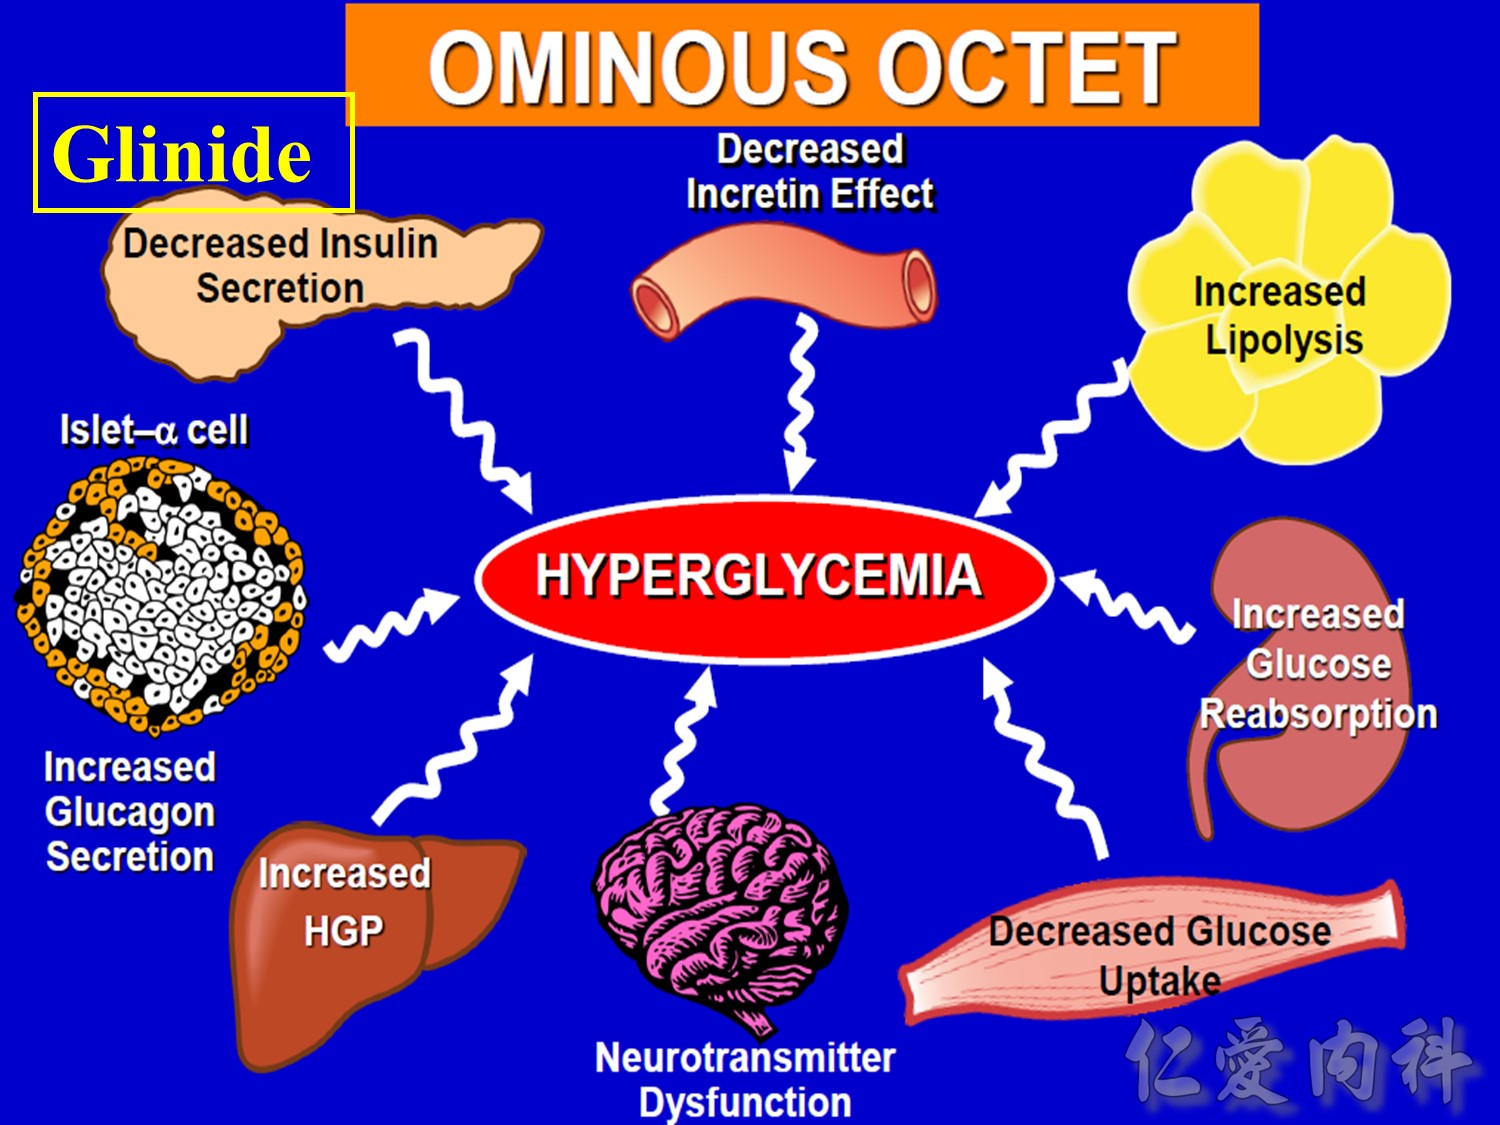
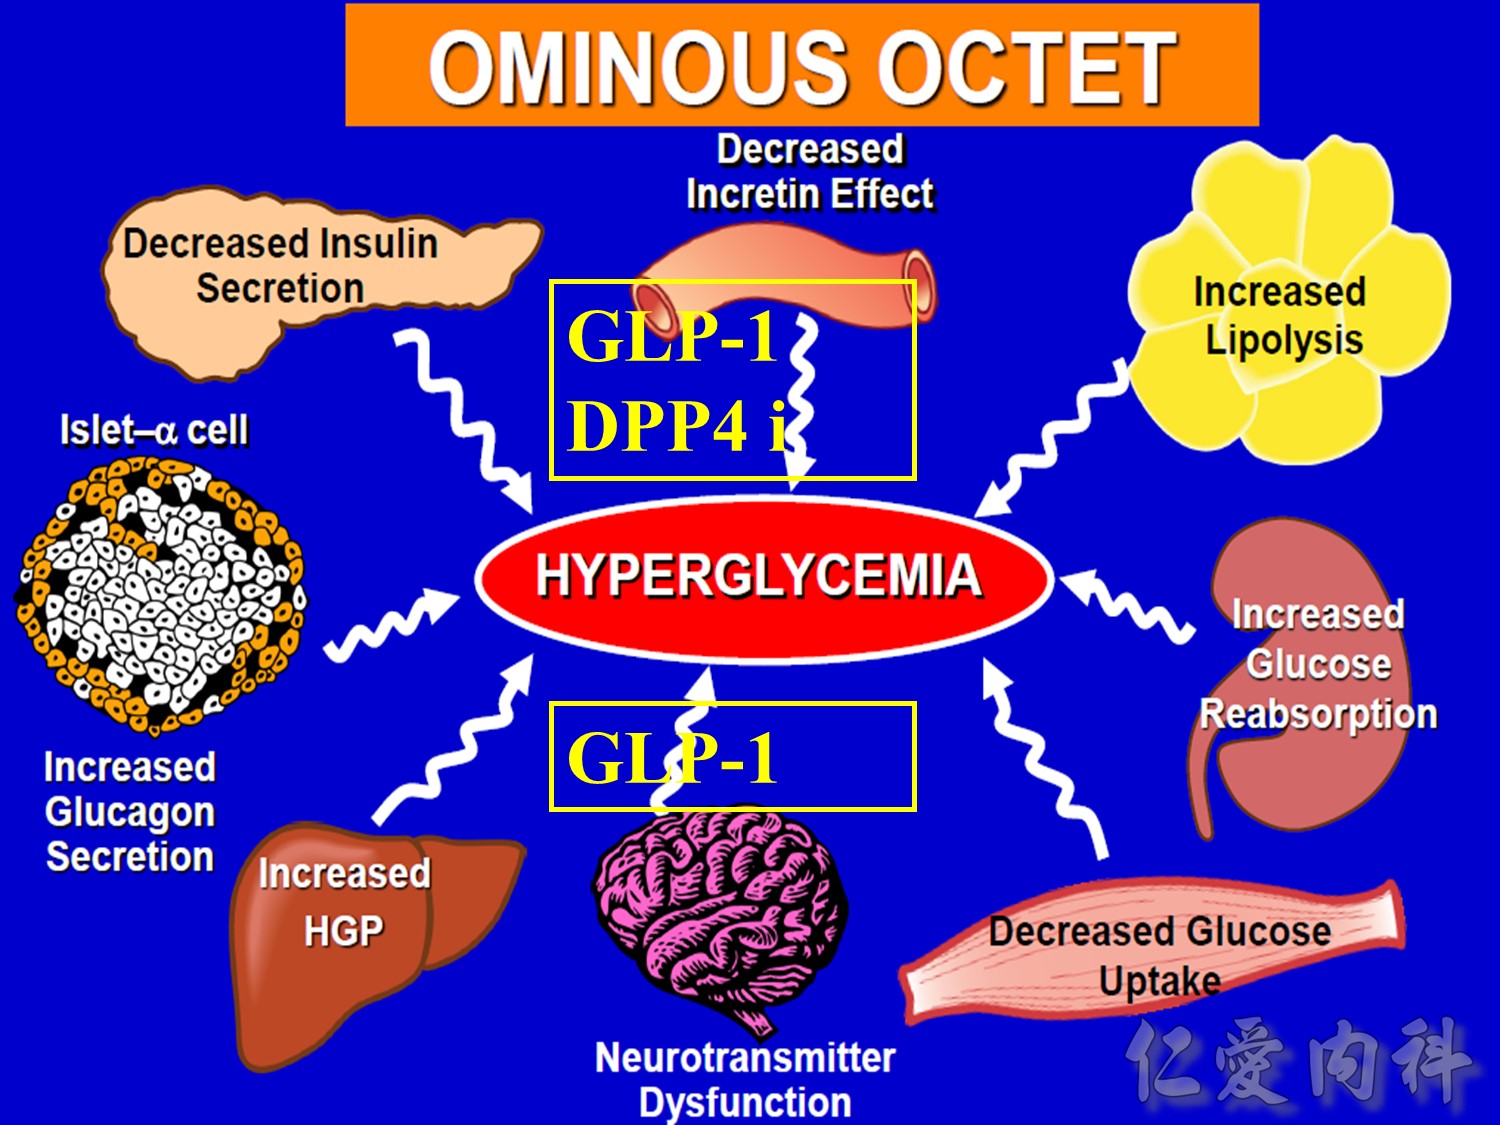
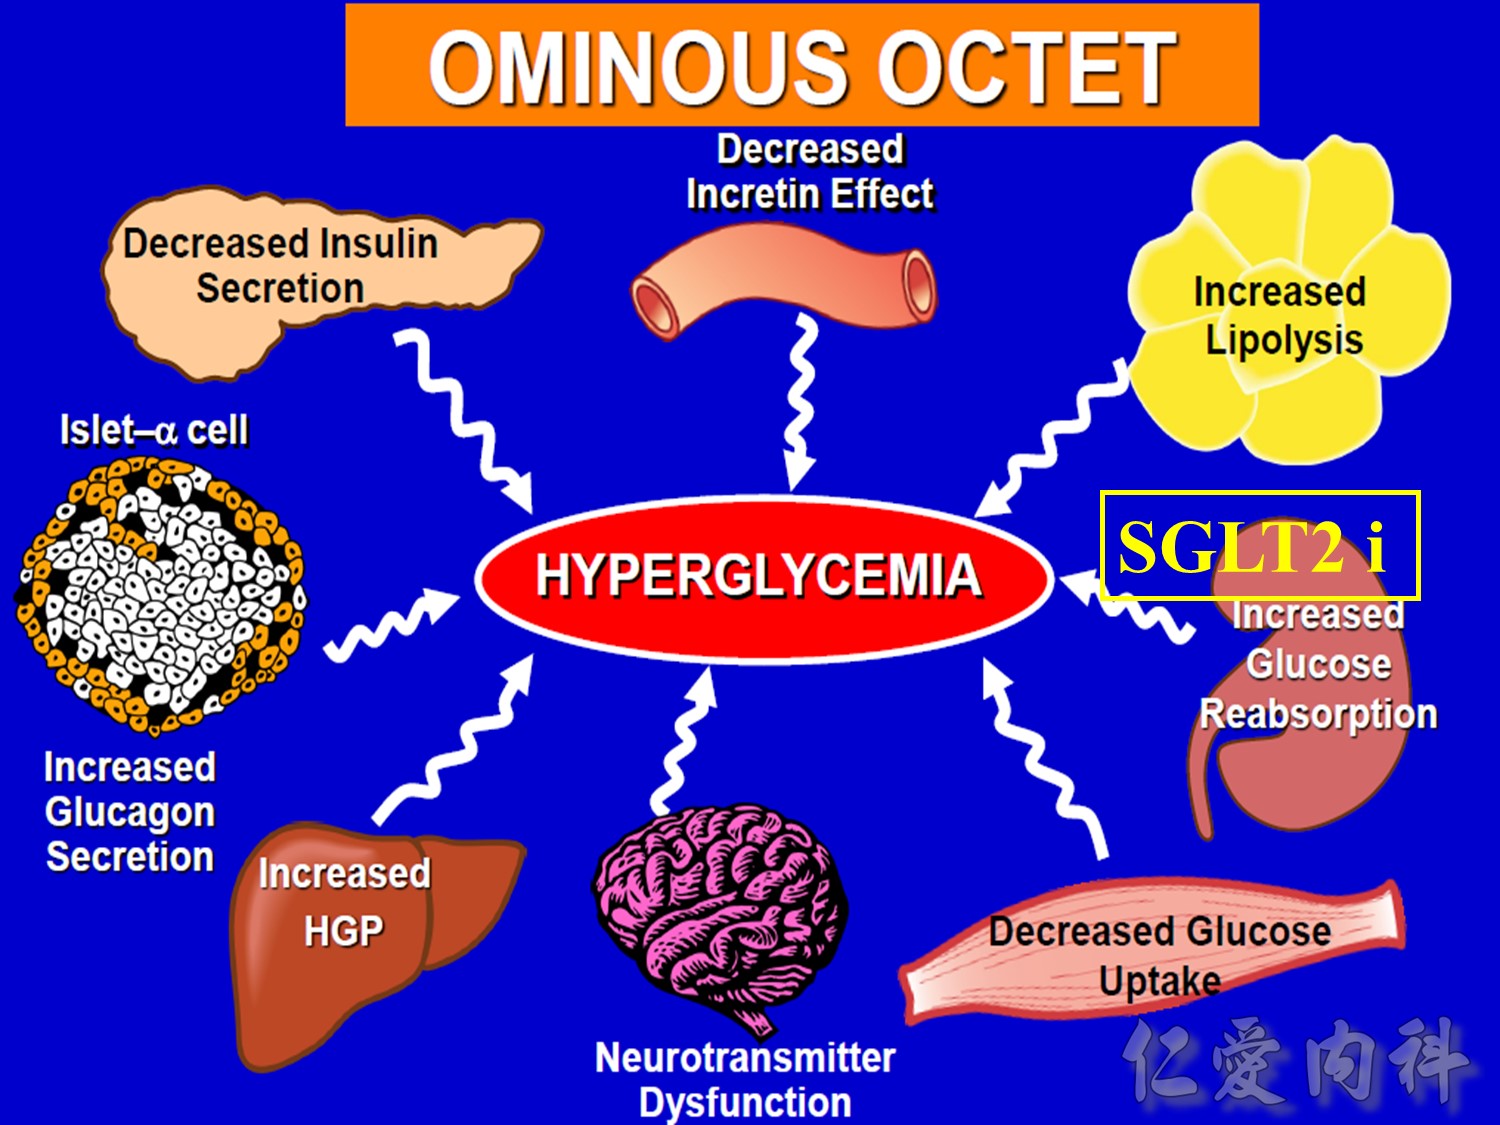
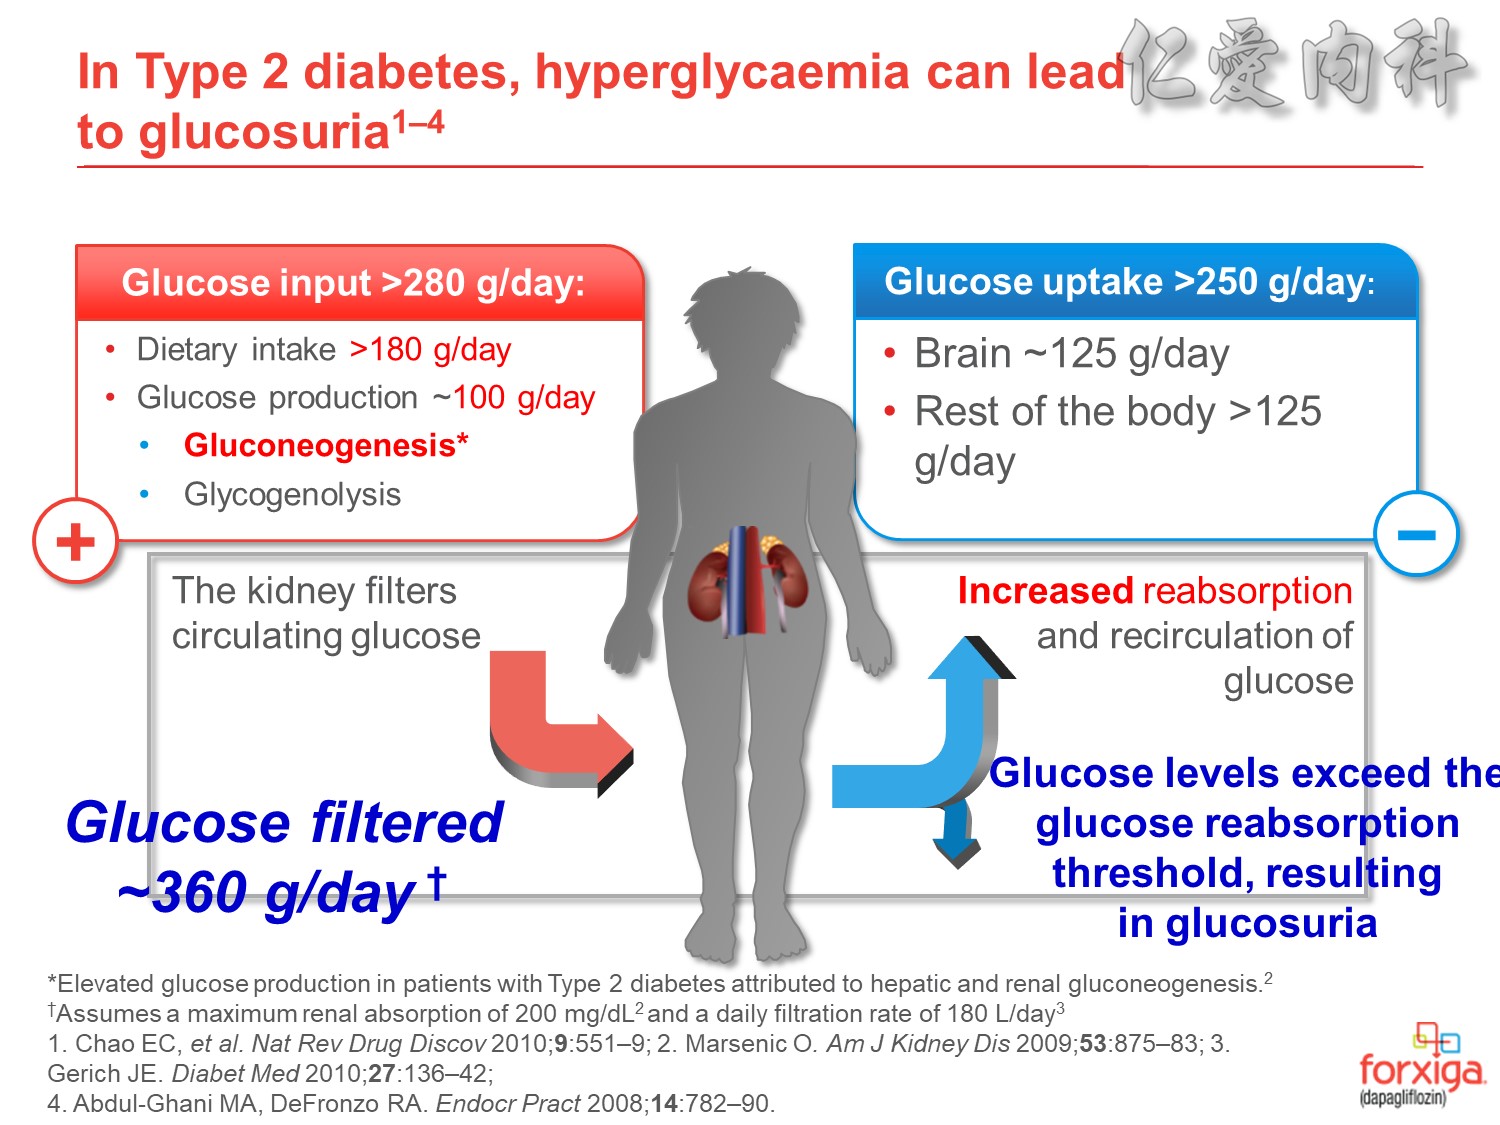
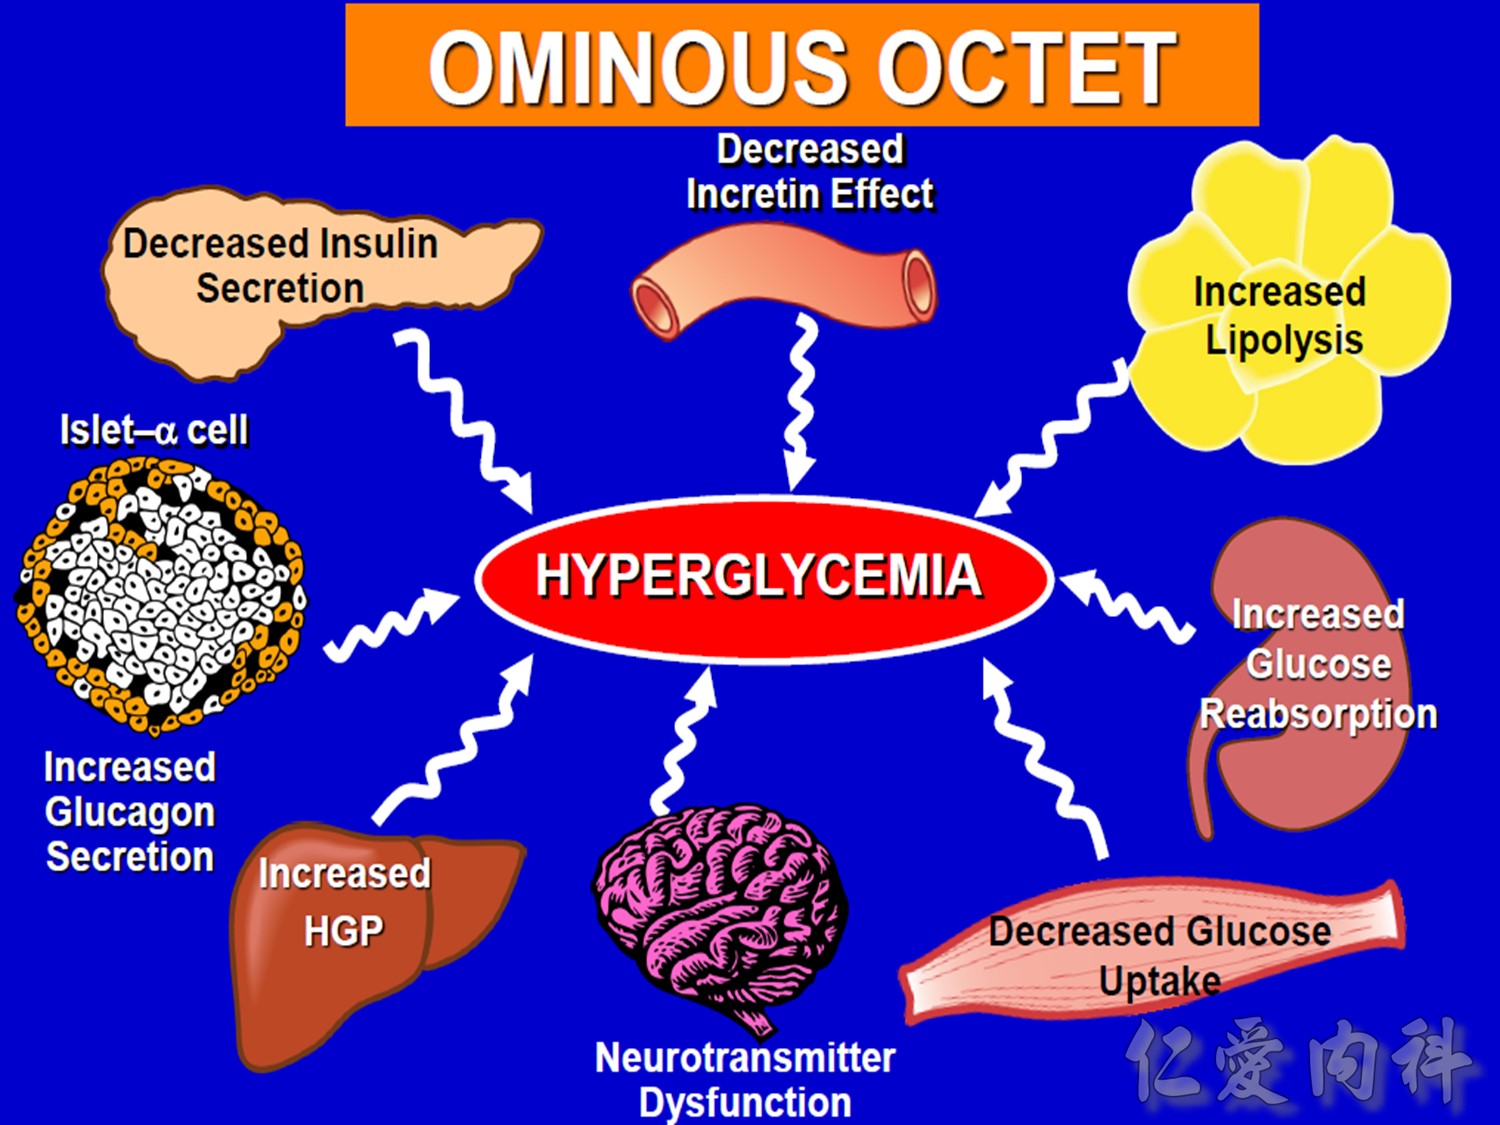
The pathophysiology of hyperglycemia in type 2 diabetes involves three main defects: (1) insulin deficiency due to insufficient pancreatic insulin release;
(2) excess hepatic glucose output; and (3) insulin resistance (decreased glucose uptake) in peripheral tissues (including muscle and fat) and the liver.1-3
Two pancreatic islet cell defects contribute to this pathology:
- Beta cells produce insulin, which facilitates glucose entry into tissues.4
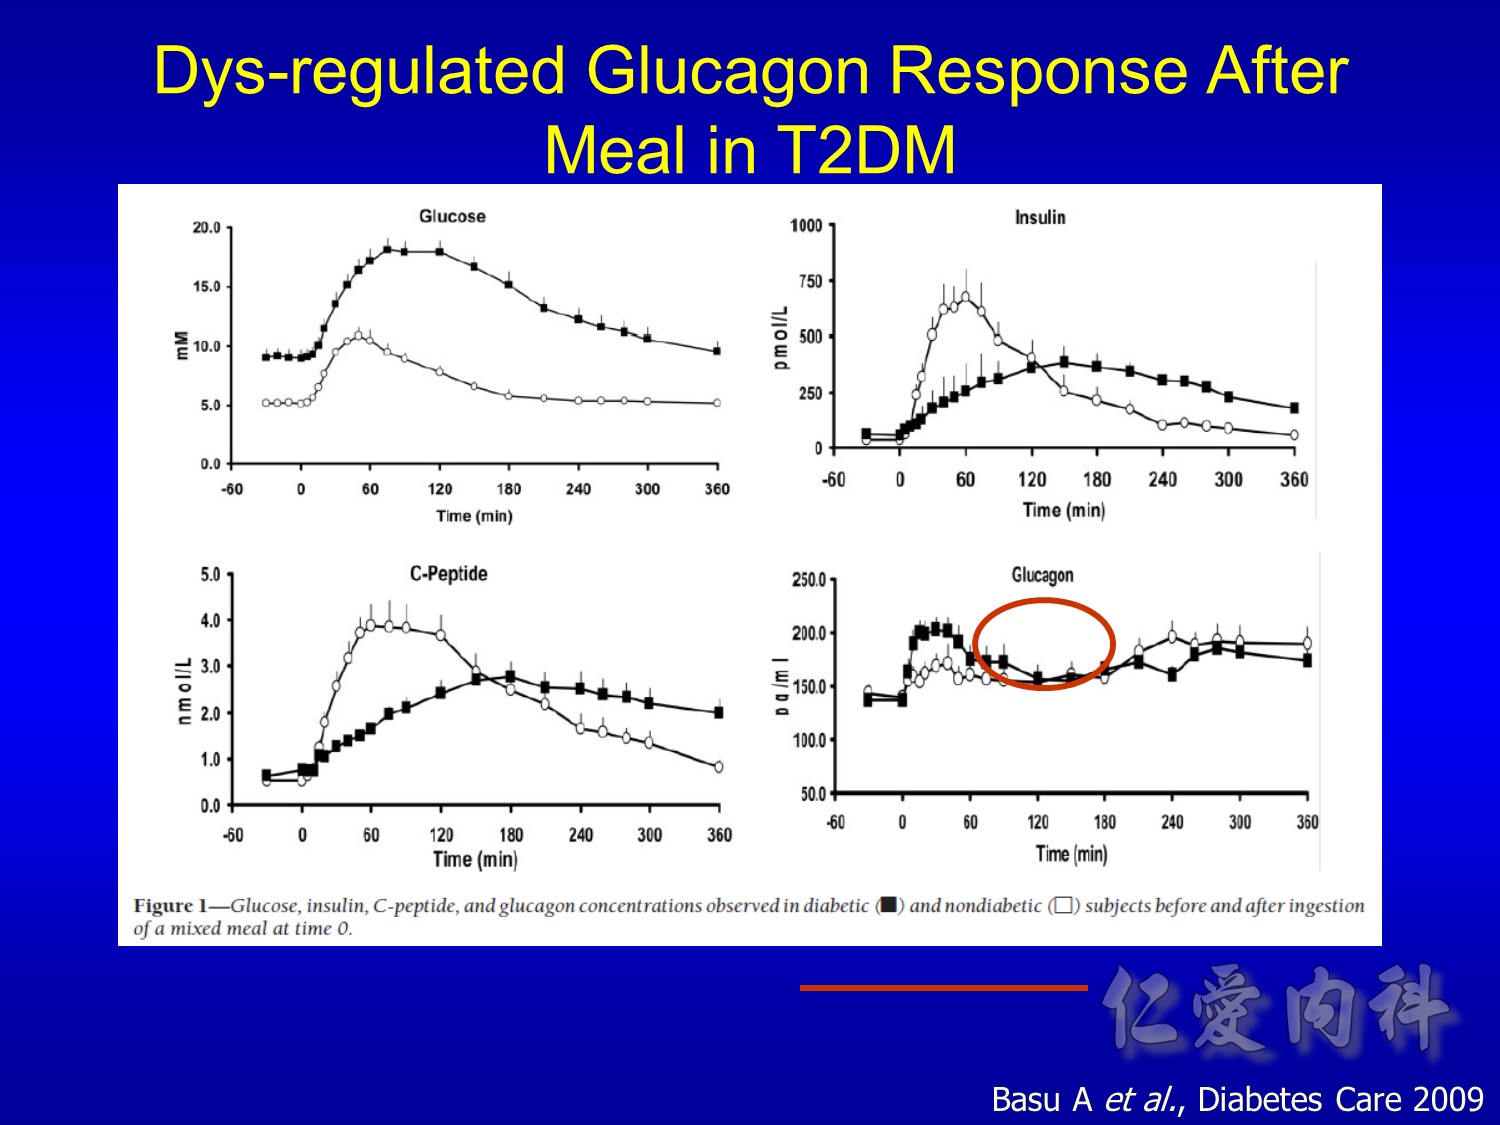
In type 2 diabetes mellitus, a decline in functional beta-cell mass causes insulin deficiency, which in turn contributes to hyperglycemia.3-5 - Alpha cells produce glucagon.6 Elevated glucagon levels promote increased hepatic glucose output.1
In type 2 diabetes mellitus, excess glucagon and diminished insulin secretion drive hepatic glucose output and contribute to hyperglycemia.1
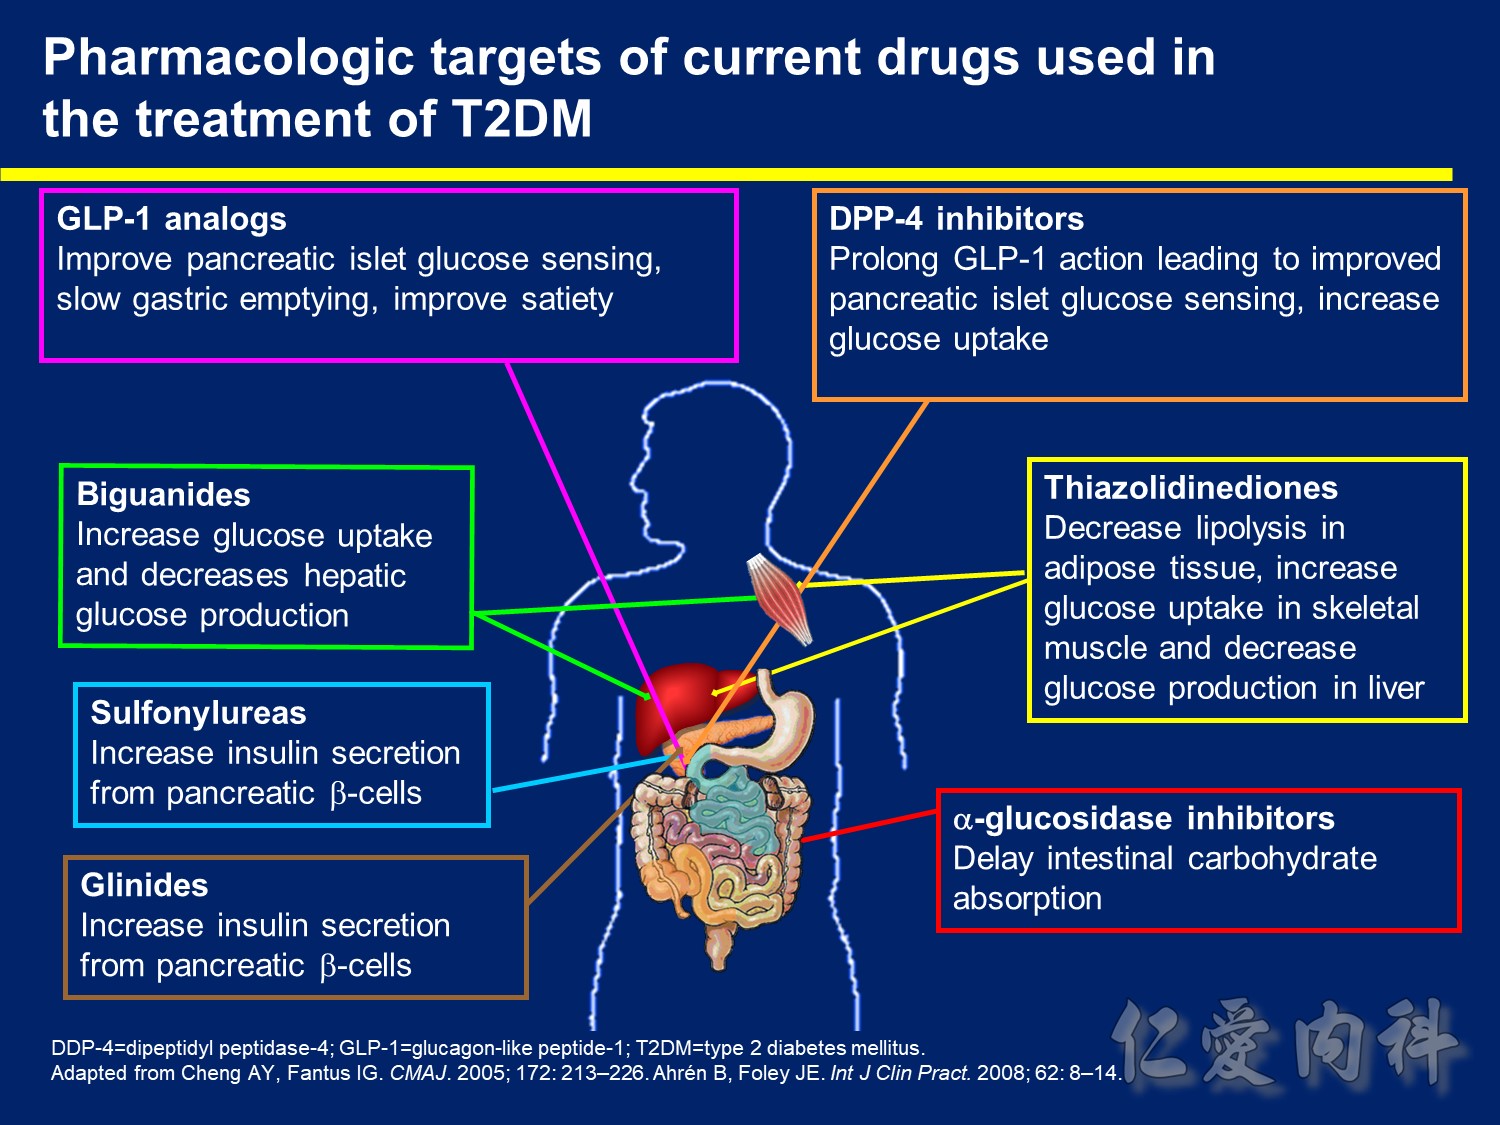
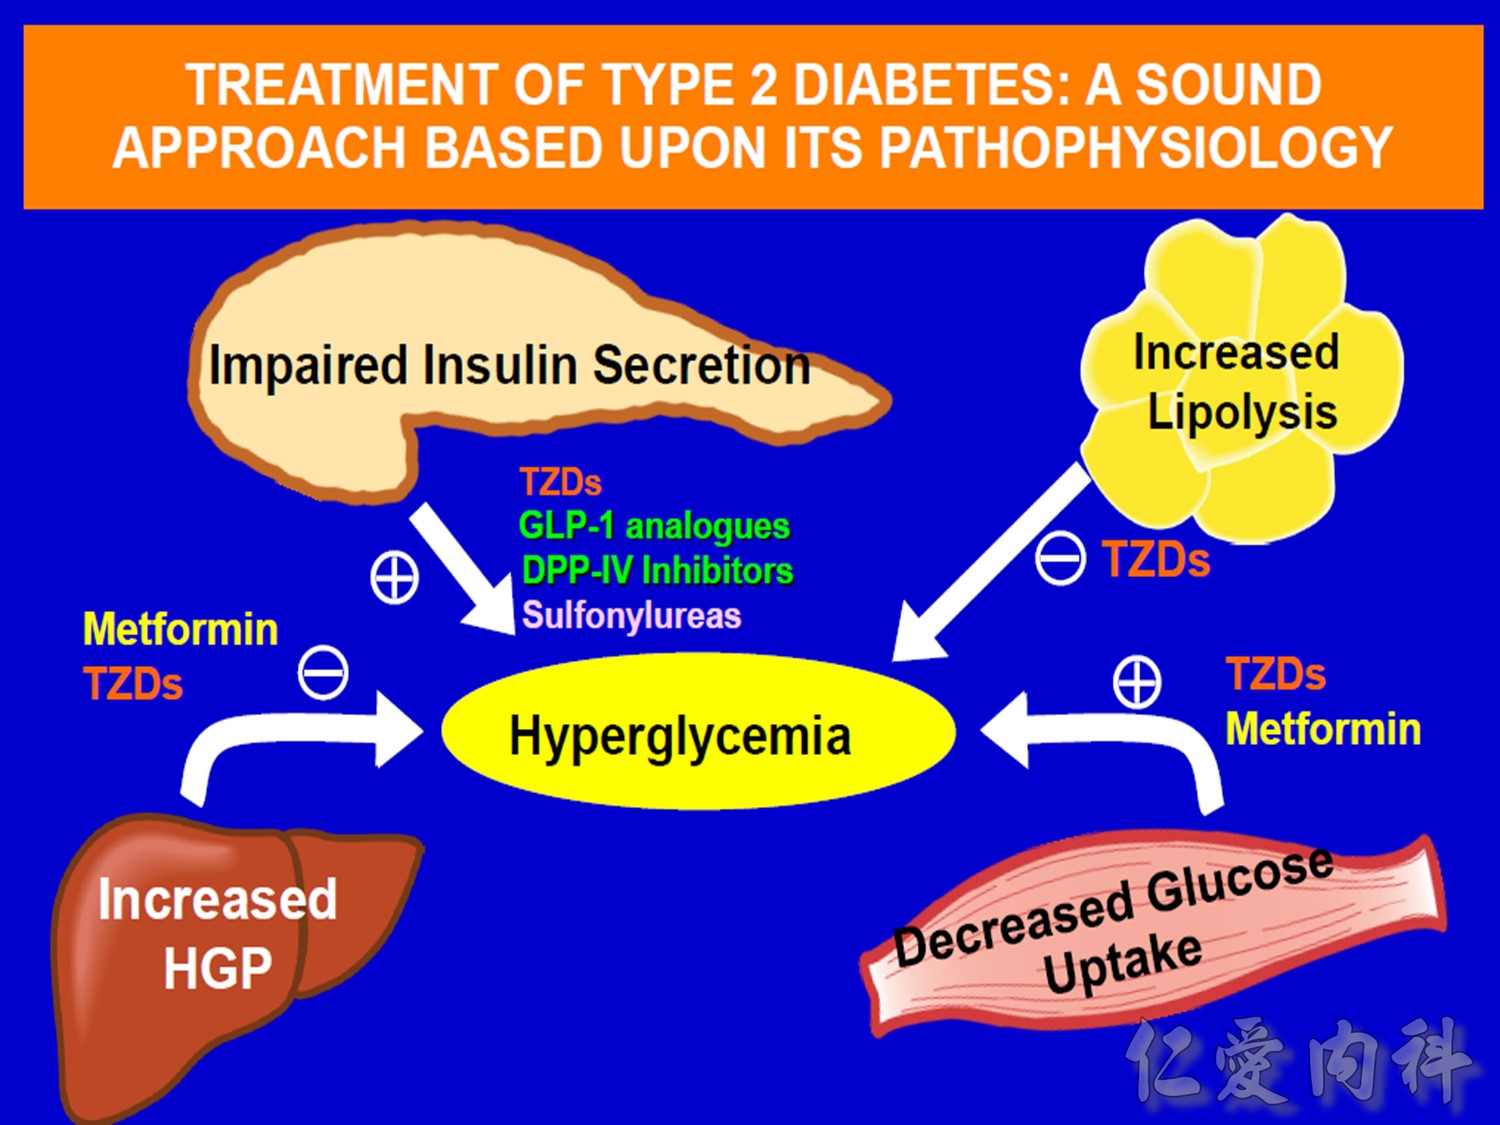
Pharmacologic Targets of Current Drugs Used in the Treatment of T2DM
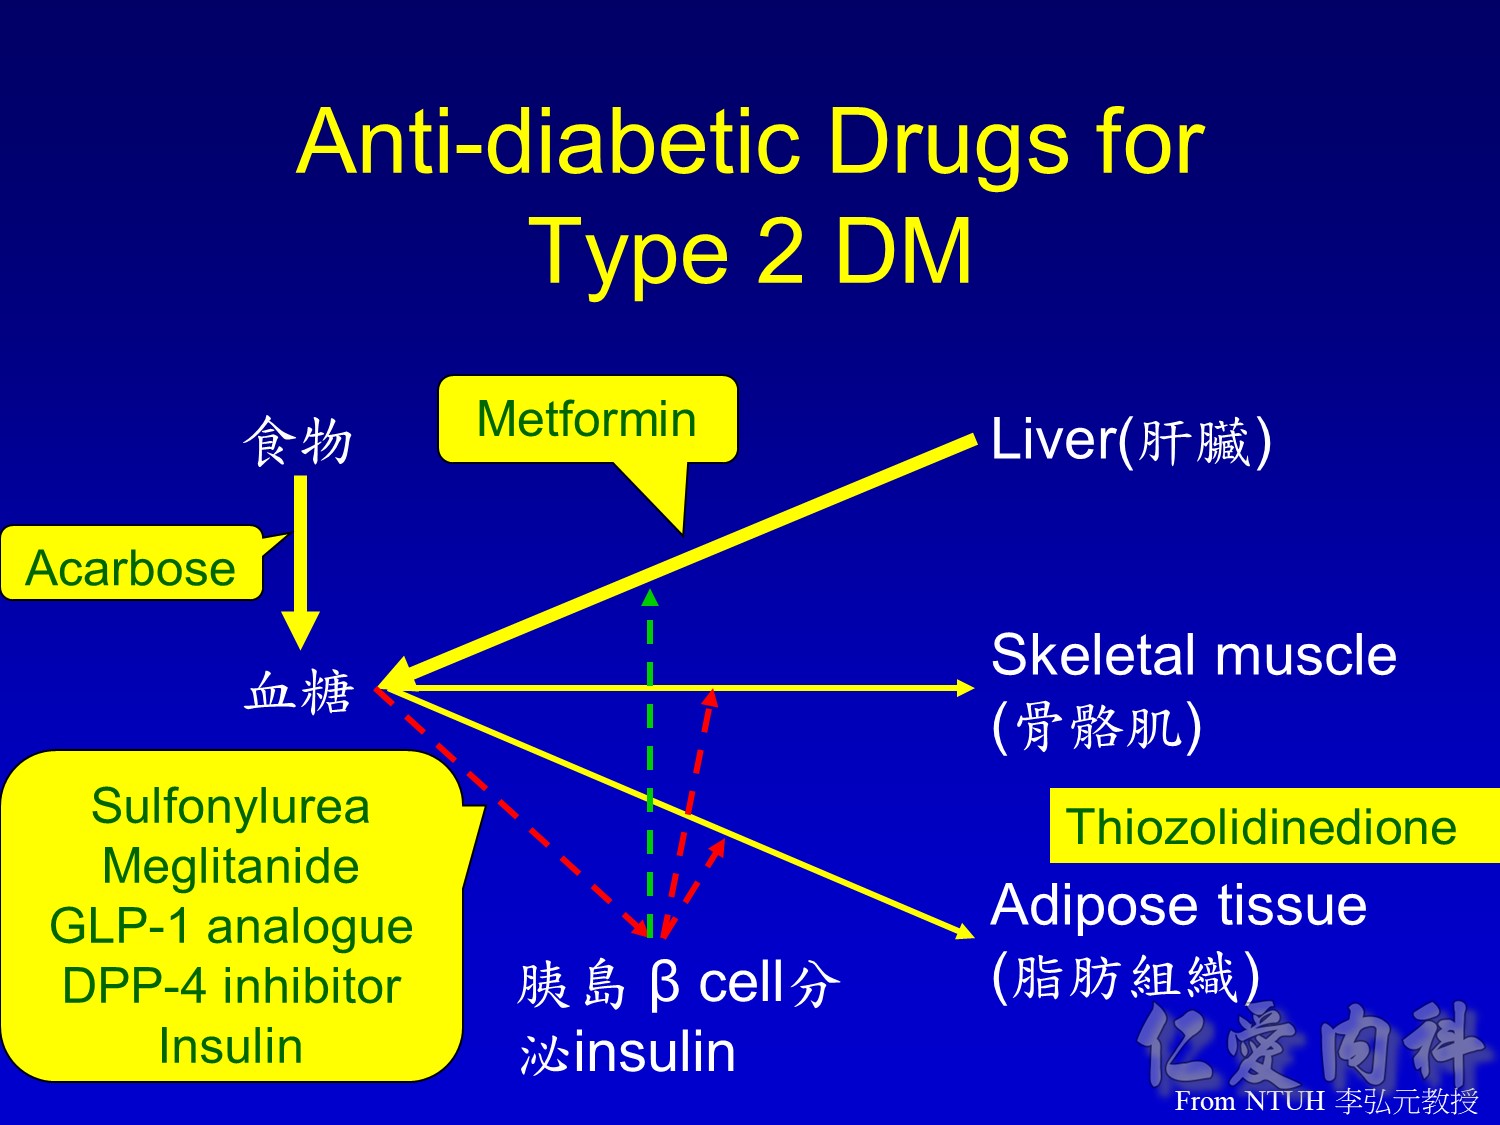
The number of antihyperglycemic drugs for use either alone, in combination, or with insulin has grown in recent years, and includes agents with widely differing mechanisms of action.1
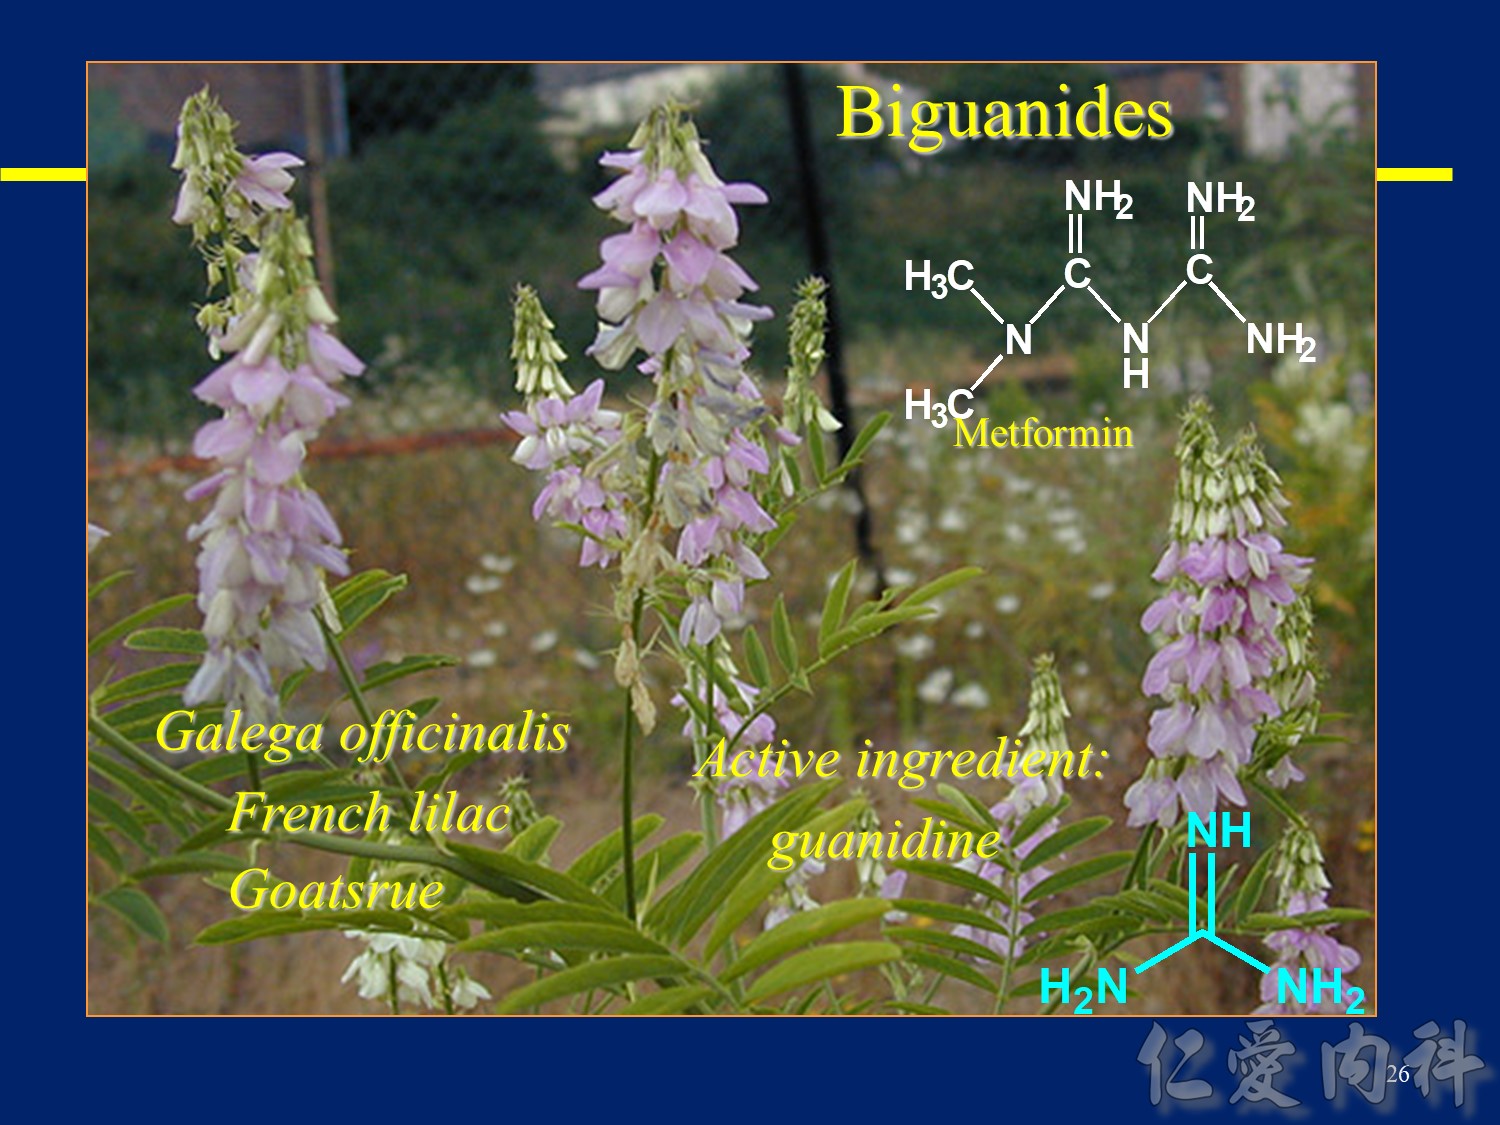
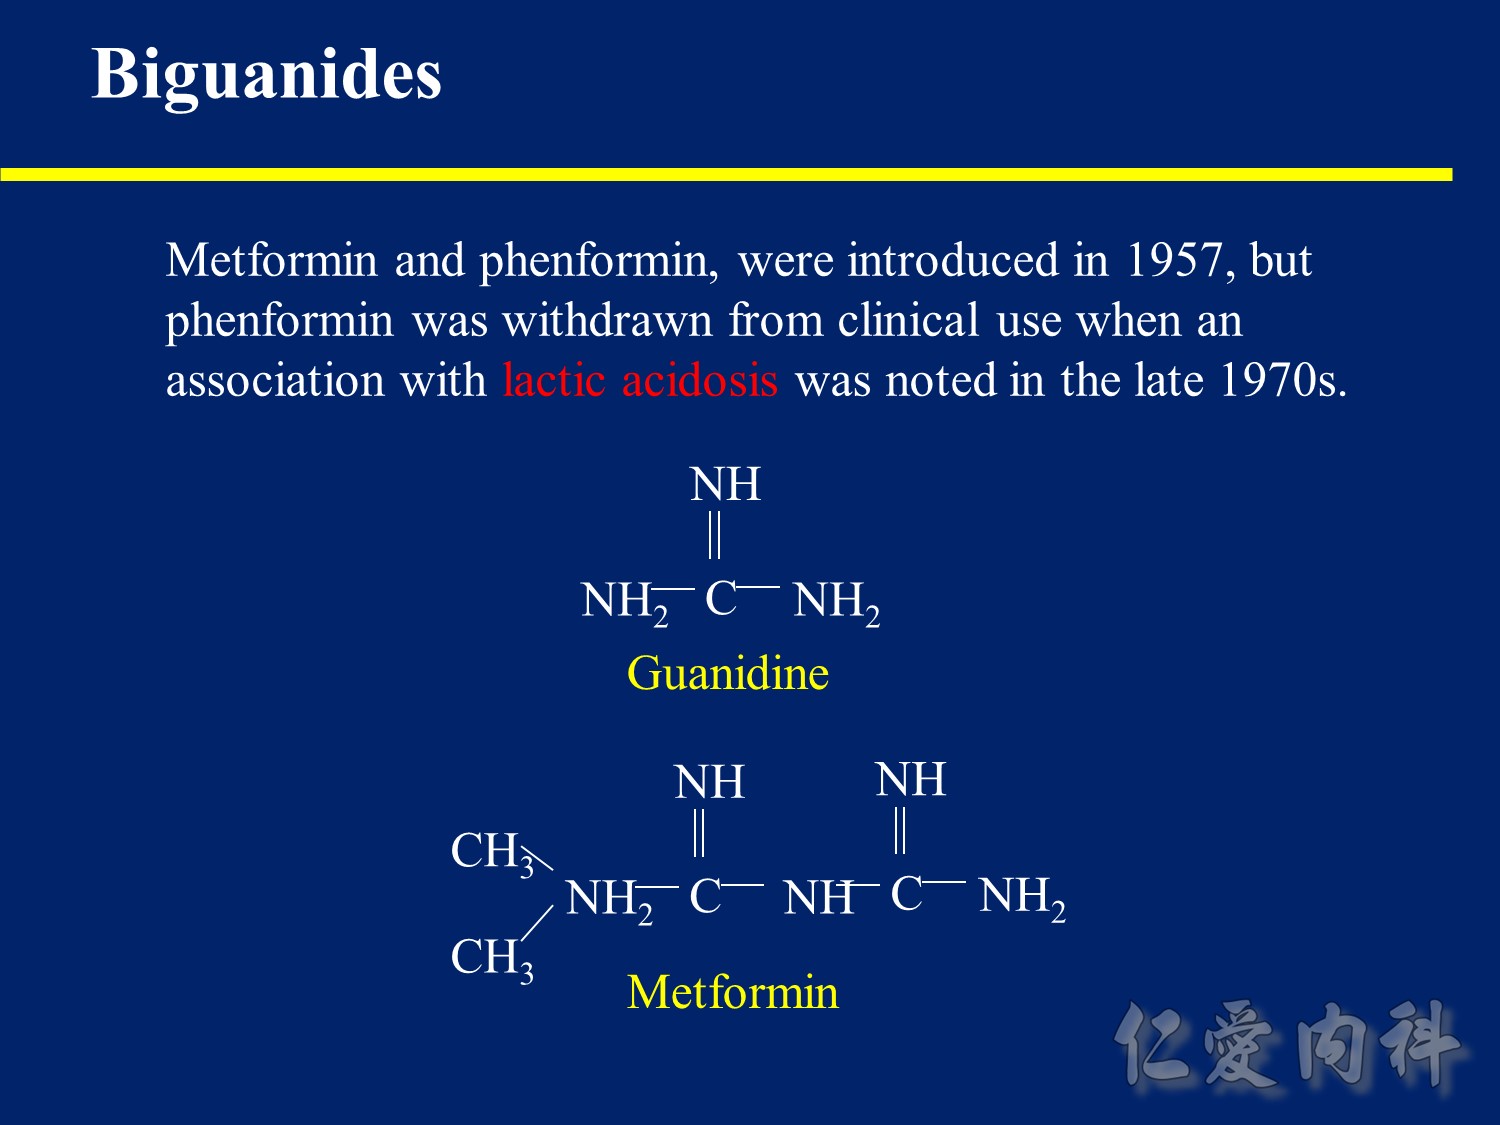
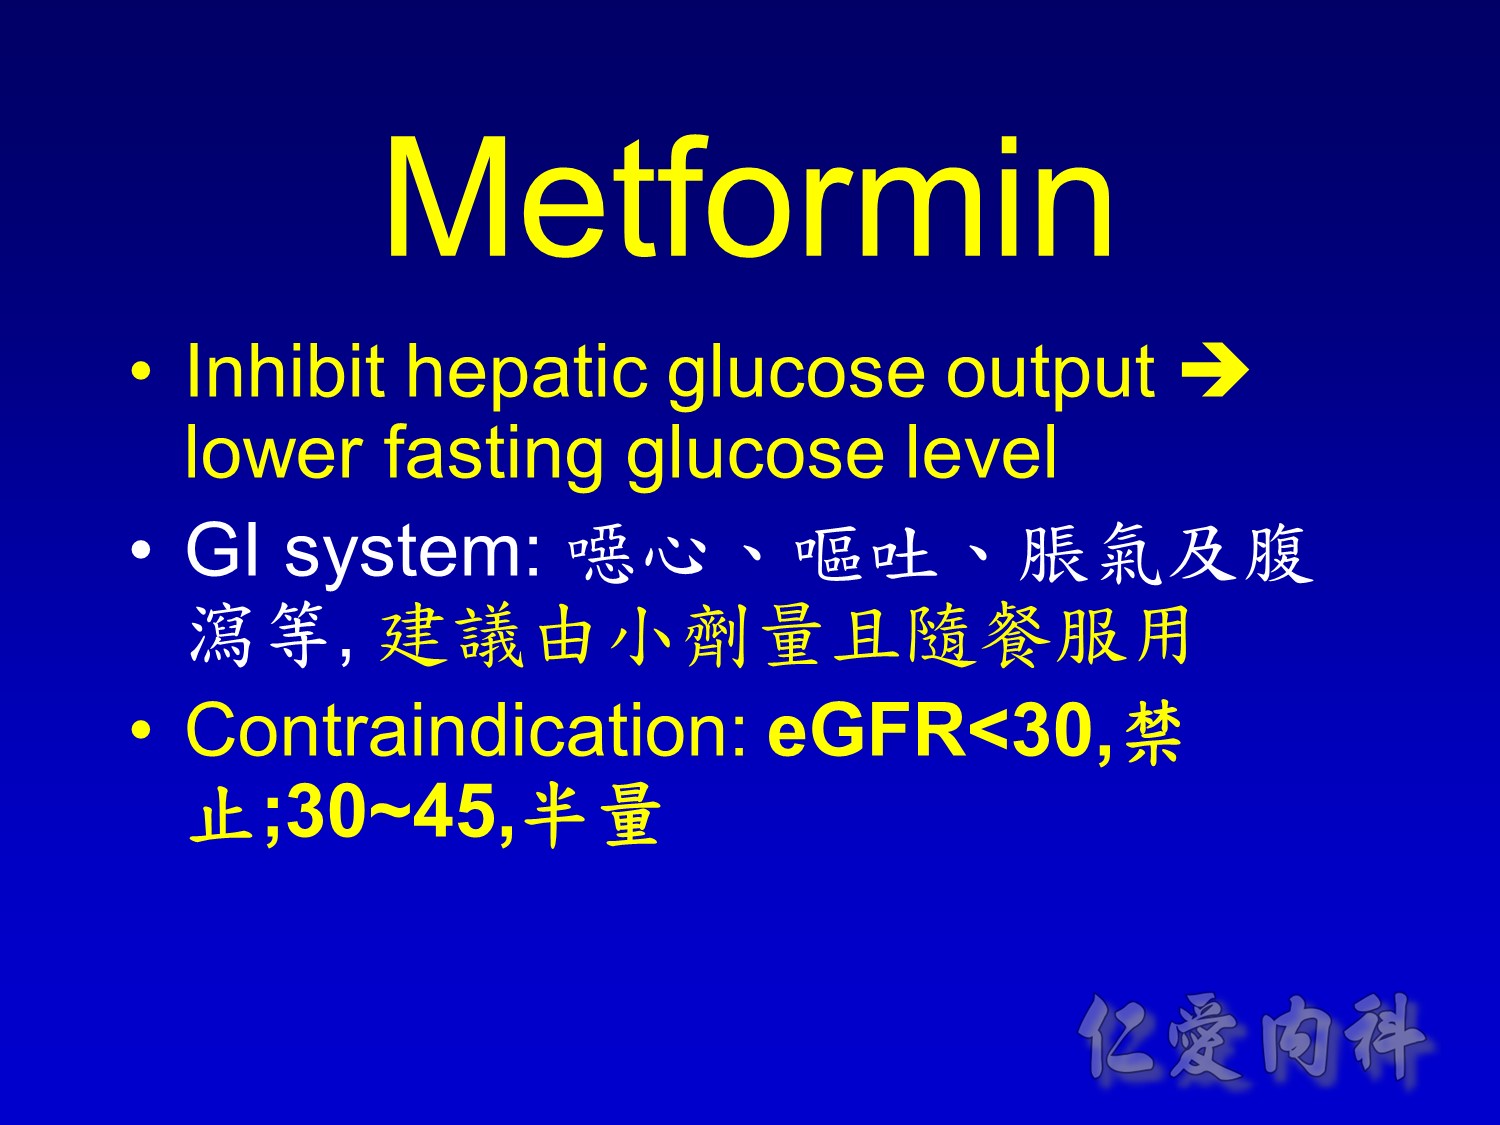
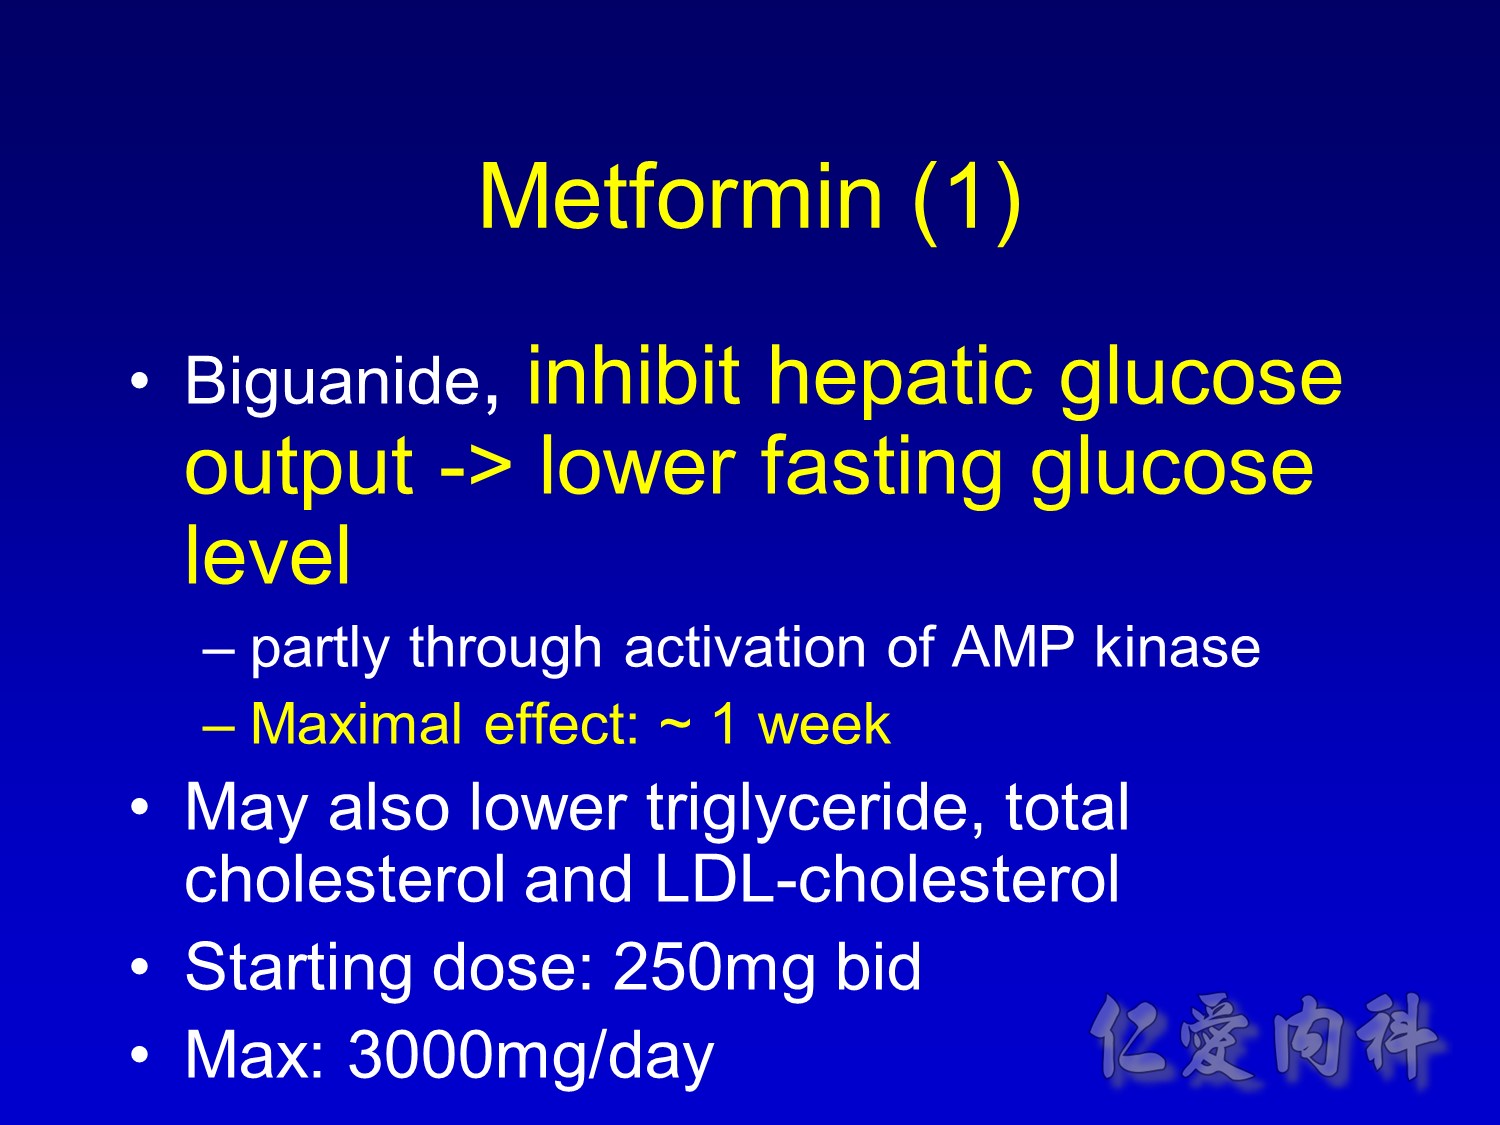
The major mechanism of action of biguanides (eg, metformin) is to decrease hepatic glucose output primarily by decreasing gluconeogenesis and, to a lesser degree, increasing glucose uptake by skeletal muscle.1
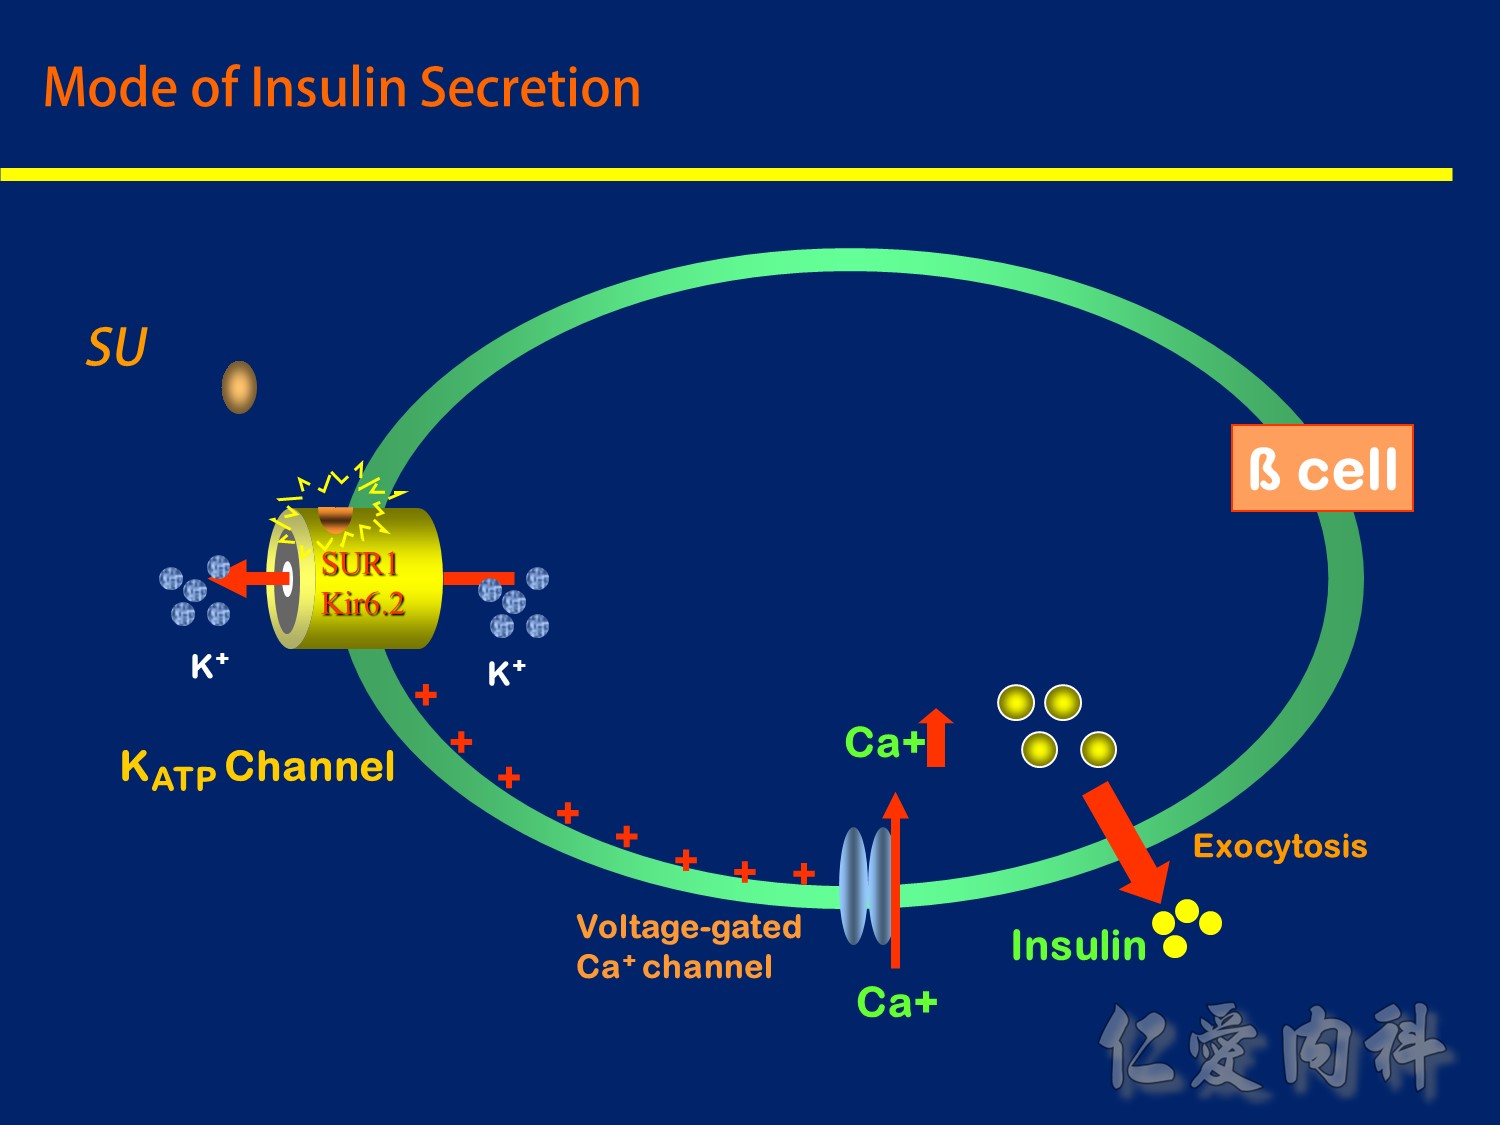
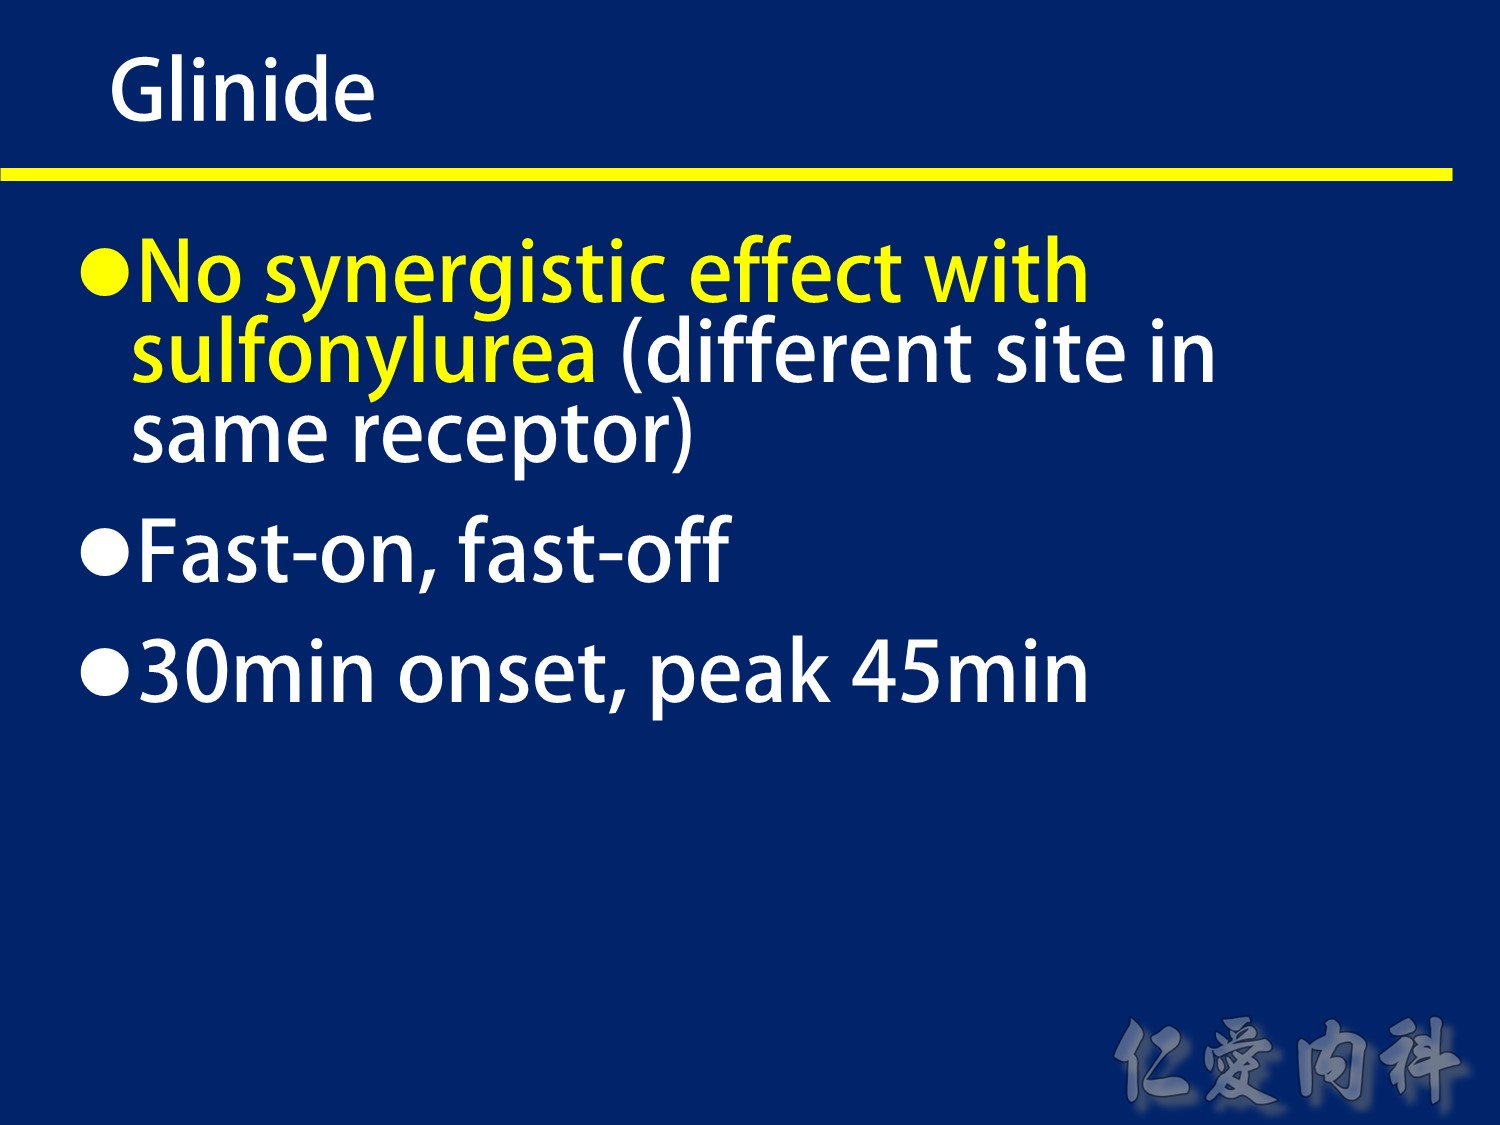
Sulfonylureas (SUs; eg, glimepiride, glyburide) and glinides (eg, nateglinide, repaglinide) stimulate insulin secretion from the β-cell. SUs bind to a specific cell-surface receptor causing metabolic changes that promote exocytosis of insulin-containing vesicles. Glinides also bind to the SU receptor with similar effects, although with a relatively prompt and brief stimulatory effect.1
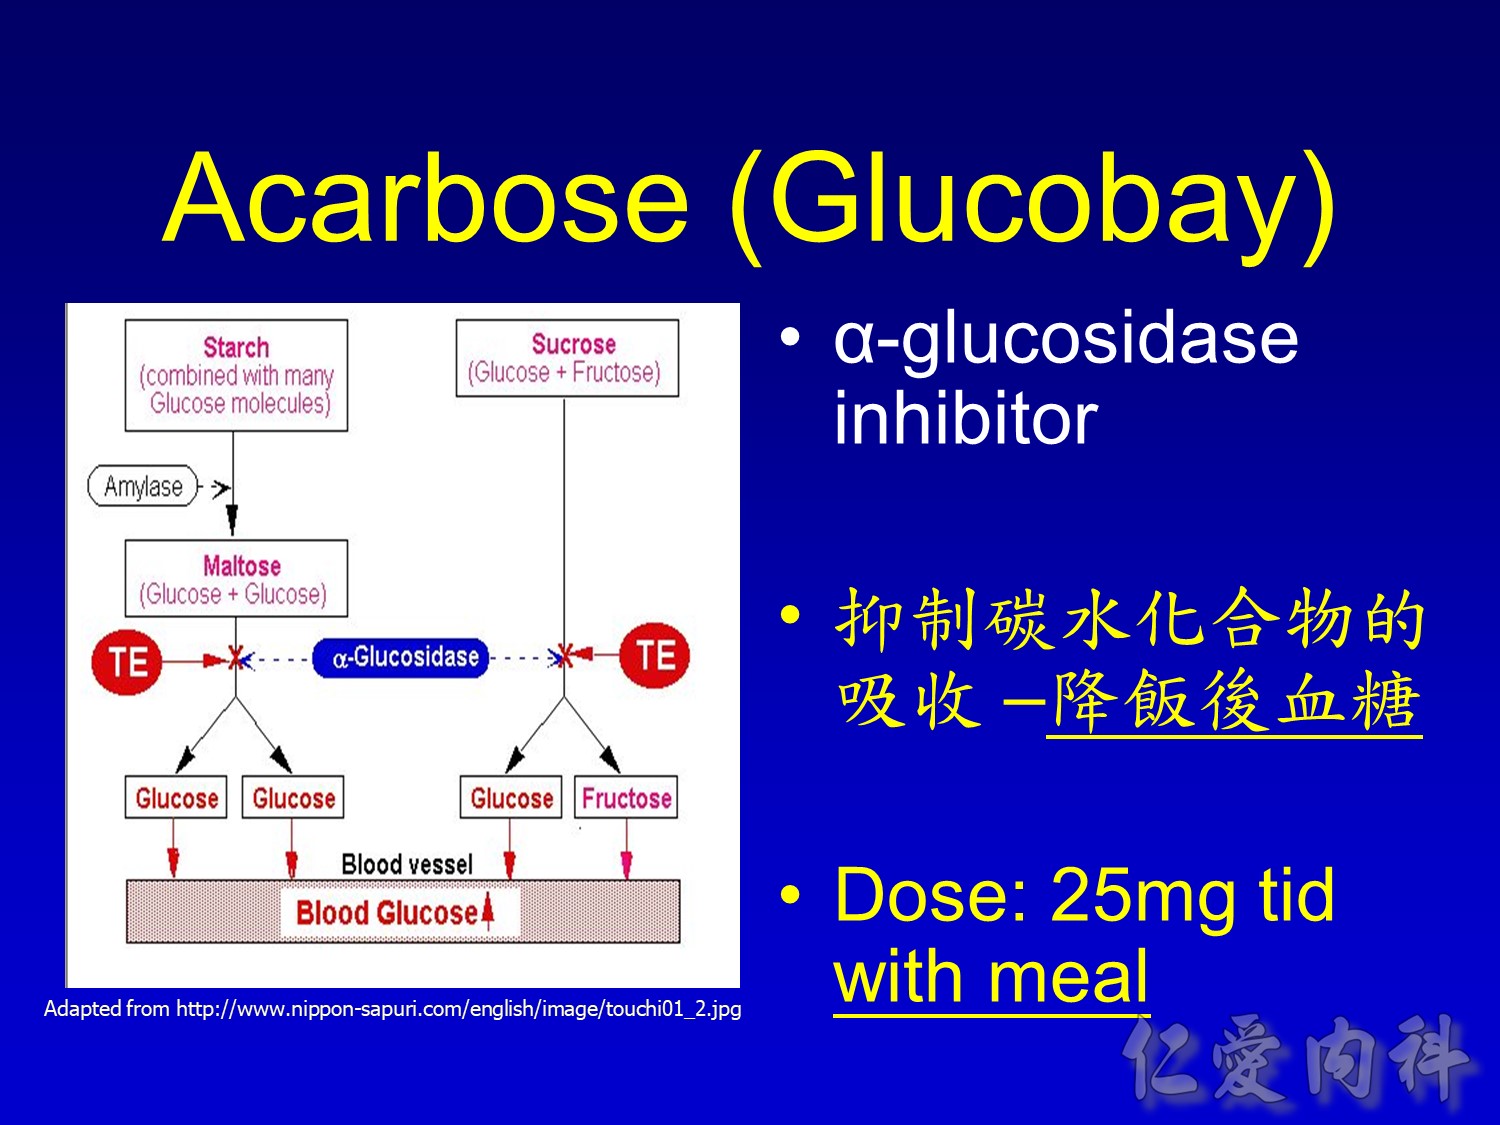
α-glucosidase inhibitors (eg, acarbose) do not target any specific pathophysiological defect in type 2 diabetes mellitus. Rather, they act by inhibiting α-glucosidase and other intestinal brush-border enzymes responsible for the breakdown of oligosaccharides and disaccharides to monosaccharides suitable for absorption.1
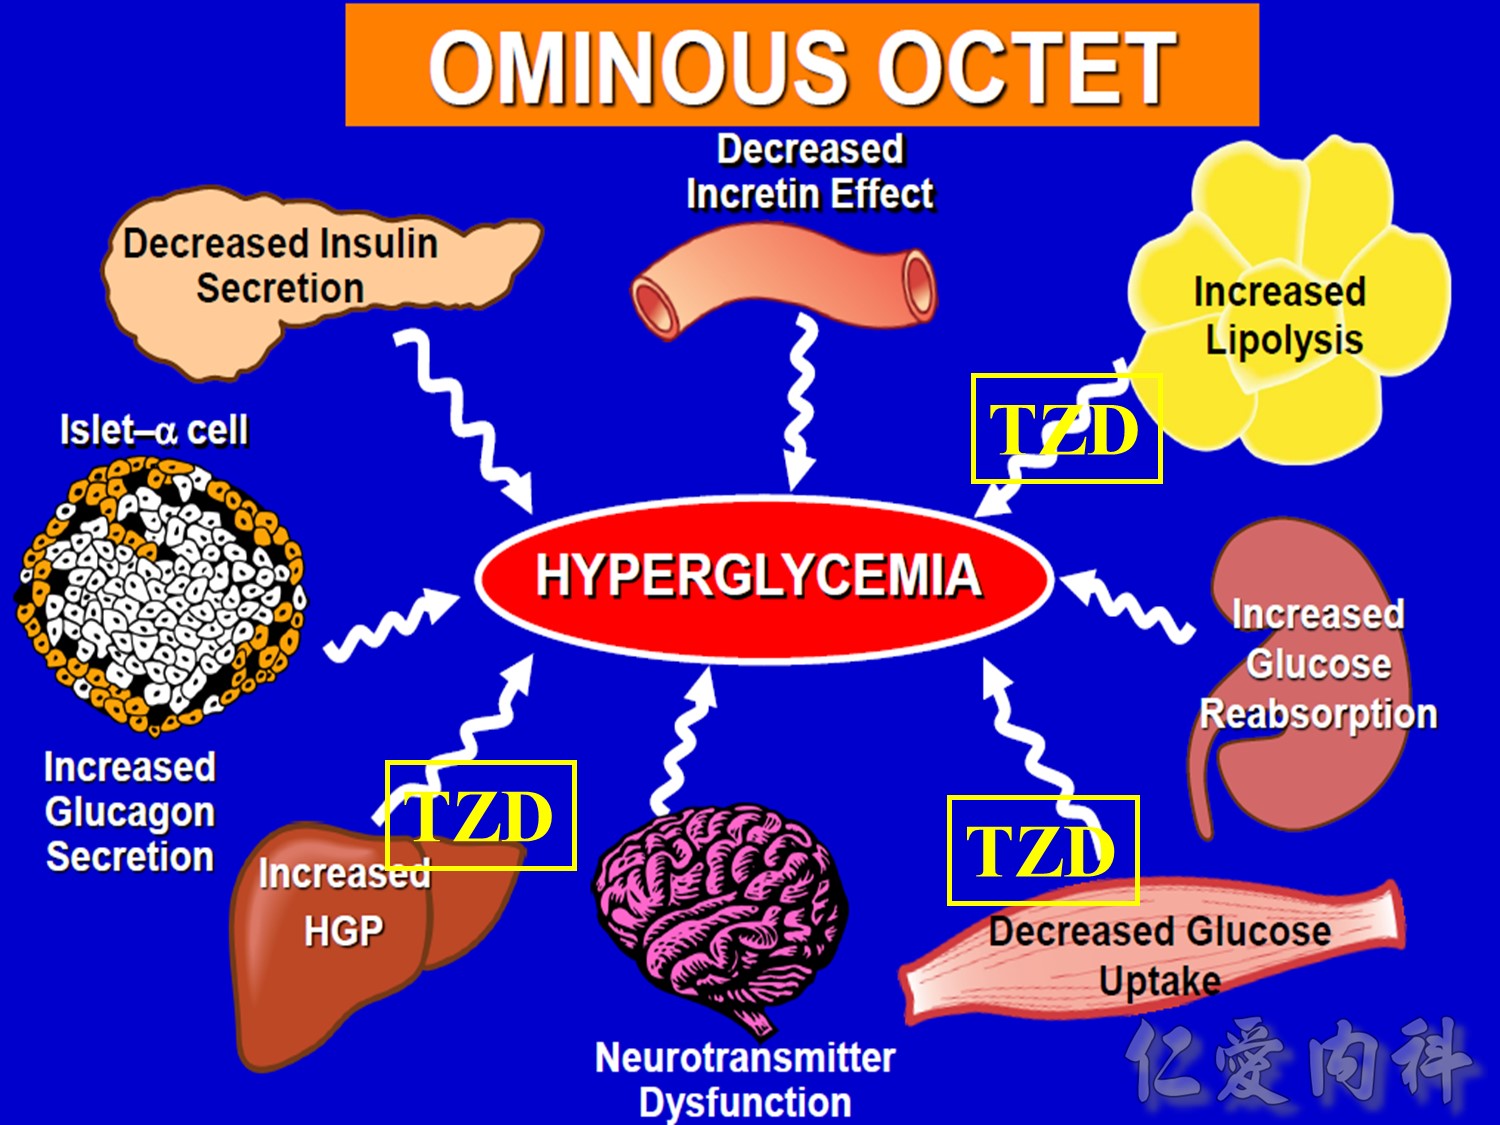
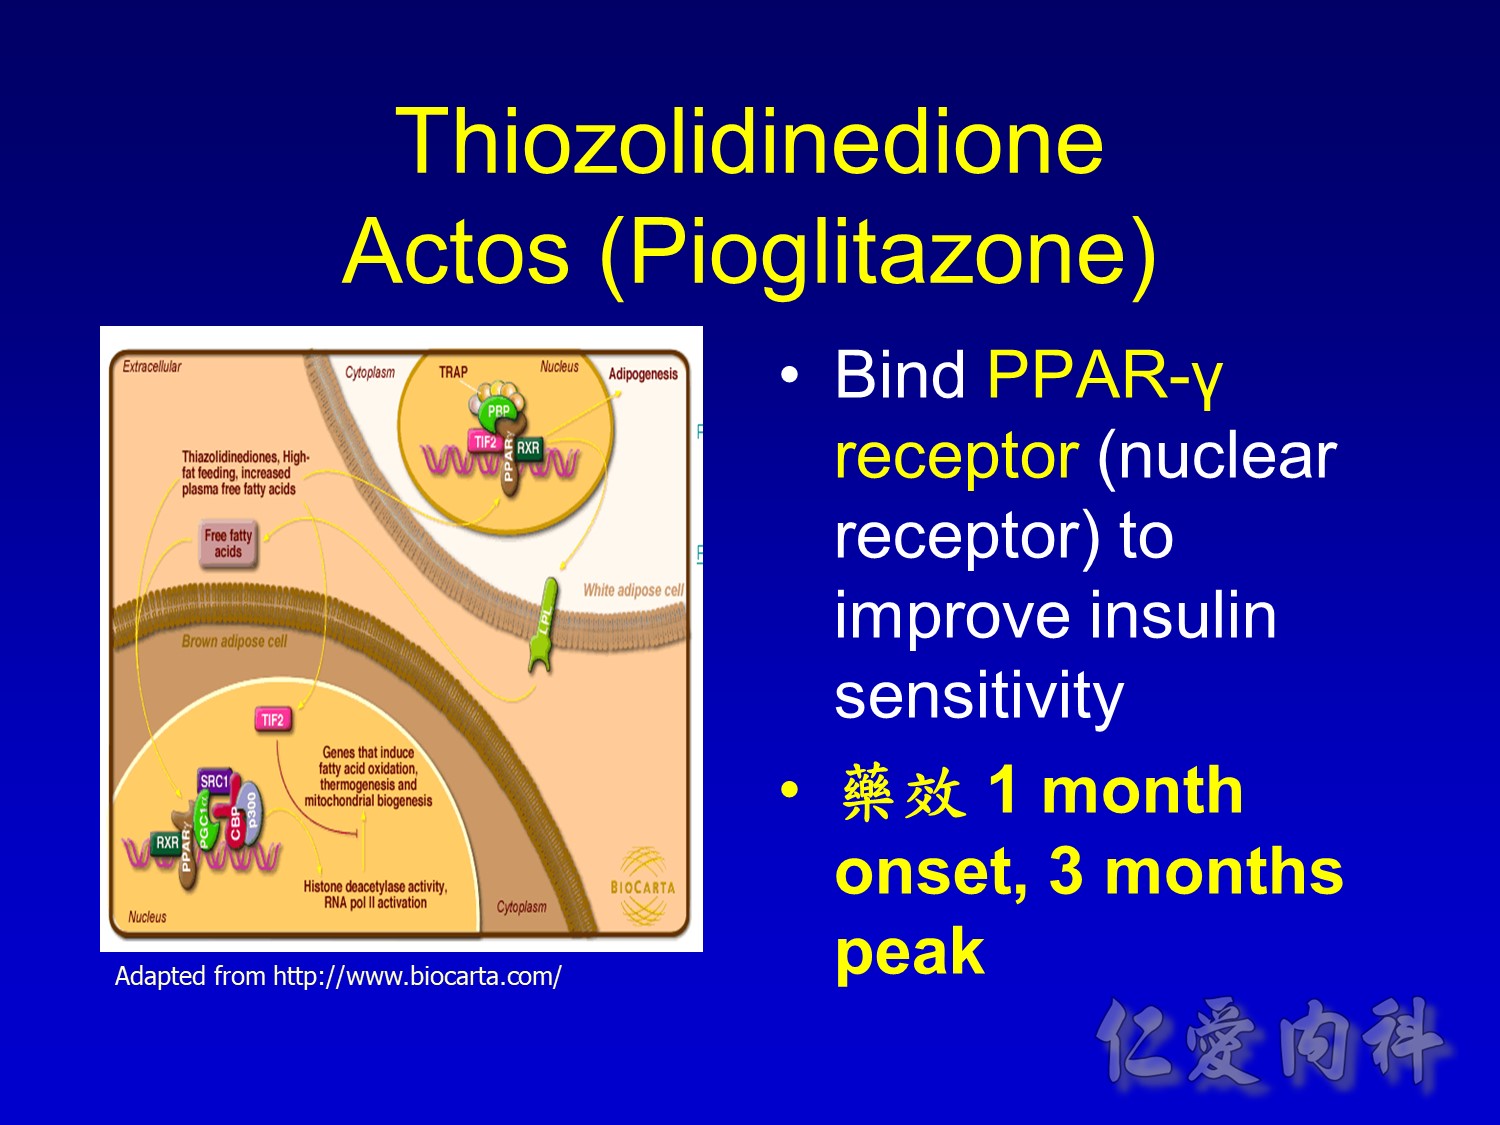
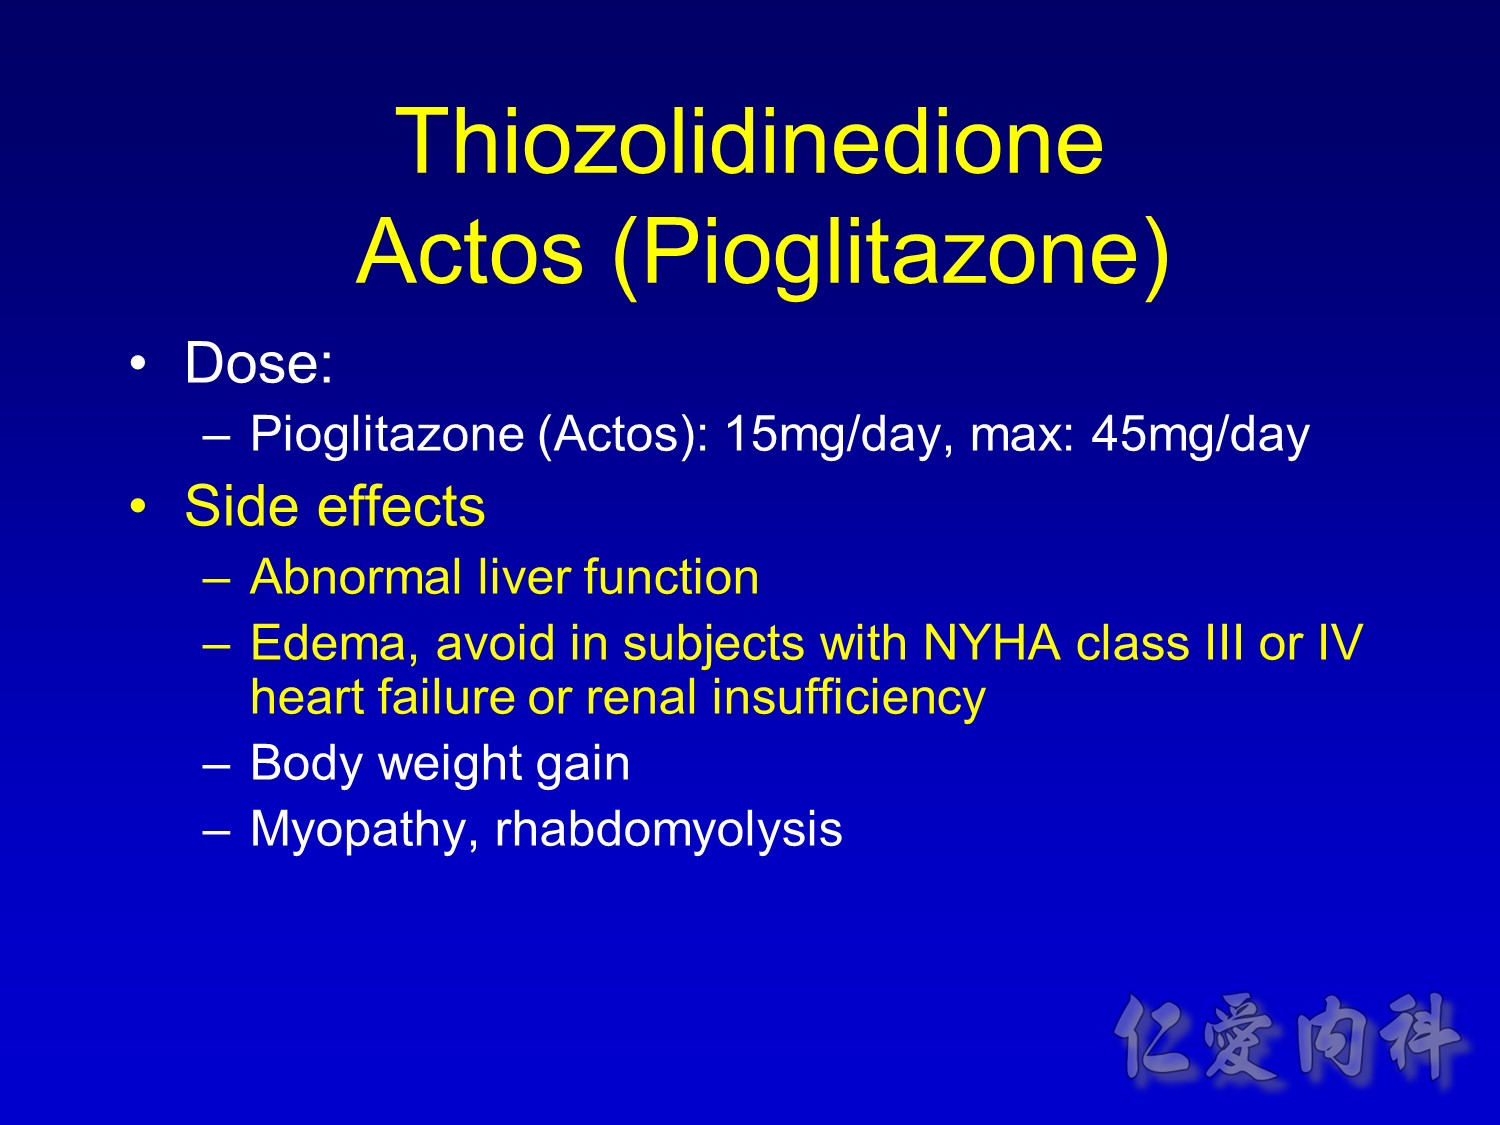
Thiazolidinediones (eg, rosiglitazone, pioglitazone) act as insulin sensitizers, particularly in peripheral tissues. They bind to a specific nuclear receptor active in adipocytes and muscle cells, promoting the expression of various genes involved in carbohydrate and lipid metabolism.1
Glucagon-like peptide (GLP-1) is an incretin hormone released by gut cells in response to food intake, promoting pancreatic islet activity. Unlike the other agents described here, GLP-1 analogs (including exenatide) are not orally available and must be injected.2
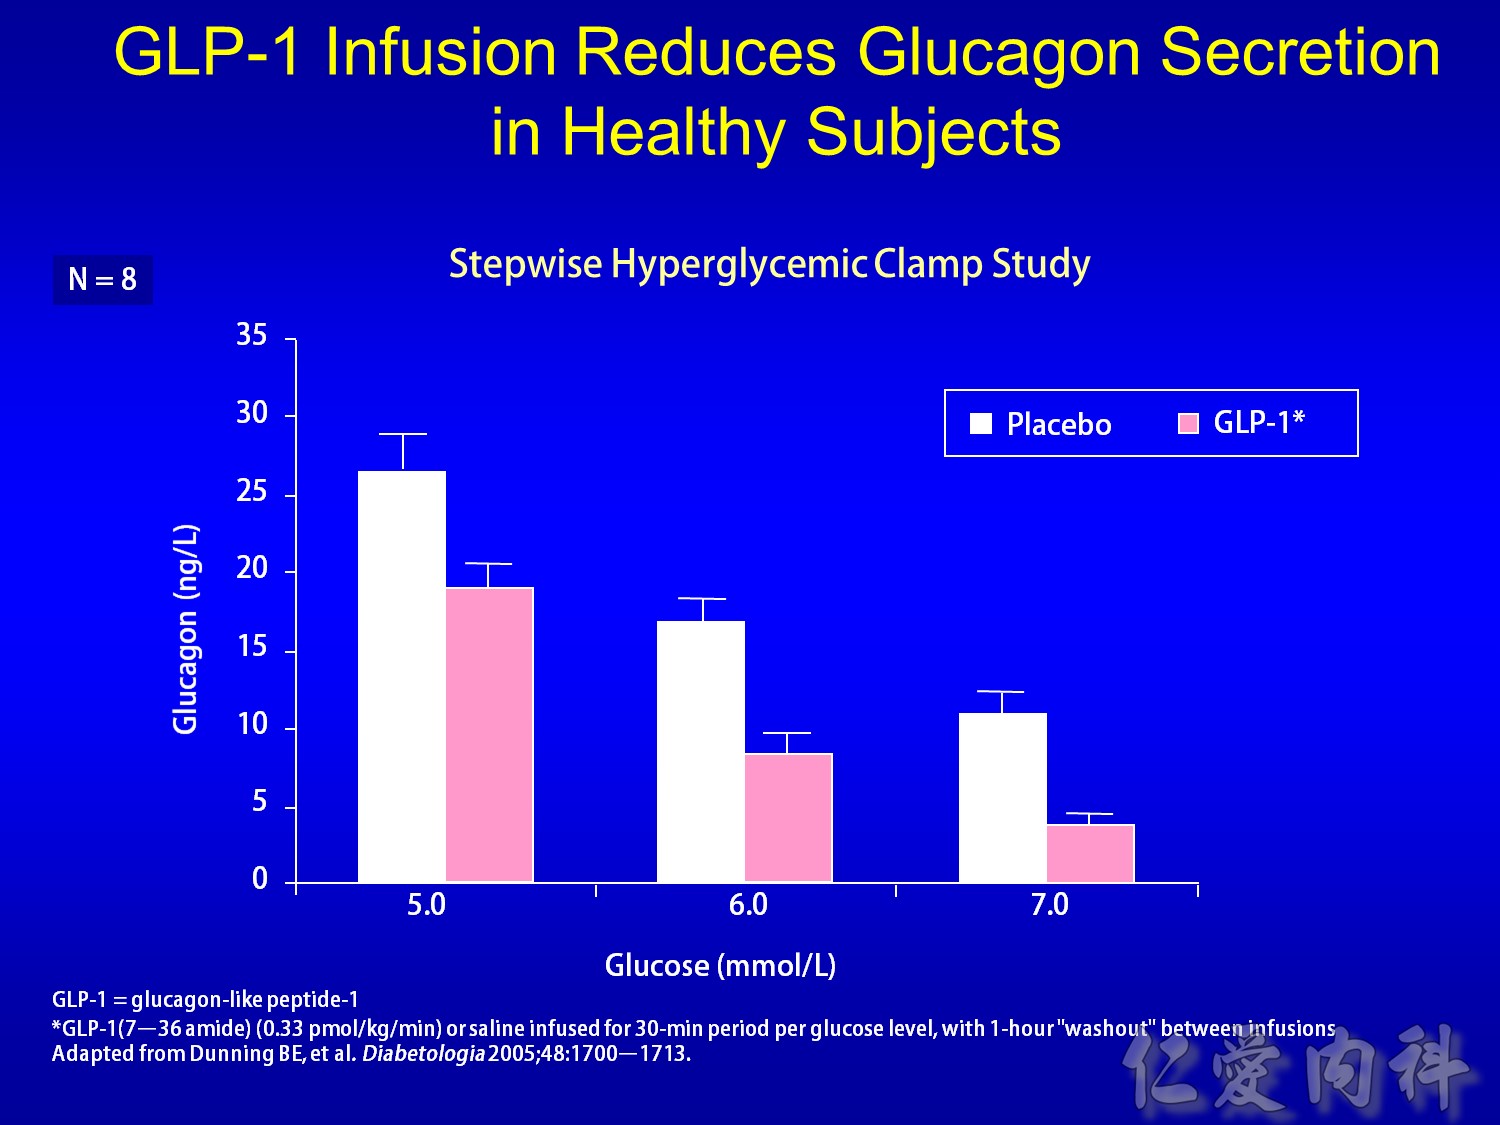
By inhibiting dipeptidyl peptidase-4 (DPP-4), DPP-4 inhibitors such as vildagliptin prolong the action of GLP-1 to stimulate insulin secretion and suppress glucagon release in response to glucose.3
References
1.Cheng AY, Fantus IG. Oral antihyperglycemic therapy for type 2 diabetes mellitus. CMAJ. 2005; 172: 213–226.
2.Drucker DJ, Nauck MA. The incretin system: glucagon-like peptide-1 receptor agonists and dipeptidyl peptidase-4 inhibitors in type 2 diabetes. Lancet. 2006; 368: 1696–1705.
3.Ahrén B, Foley JE. The islet enhancer vildagliptin: mechanisms of improved glucose metabolism. Int J Clin Pract. 2008; 62(suppl 159): 8–14.


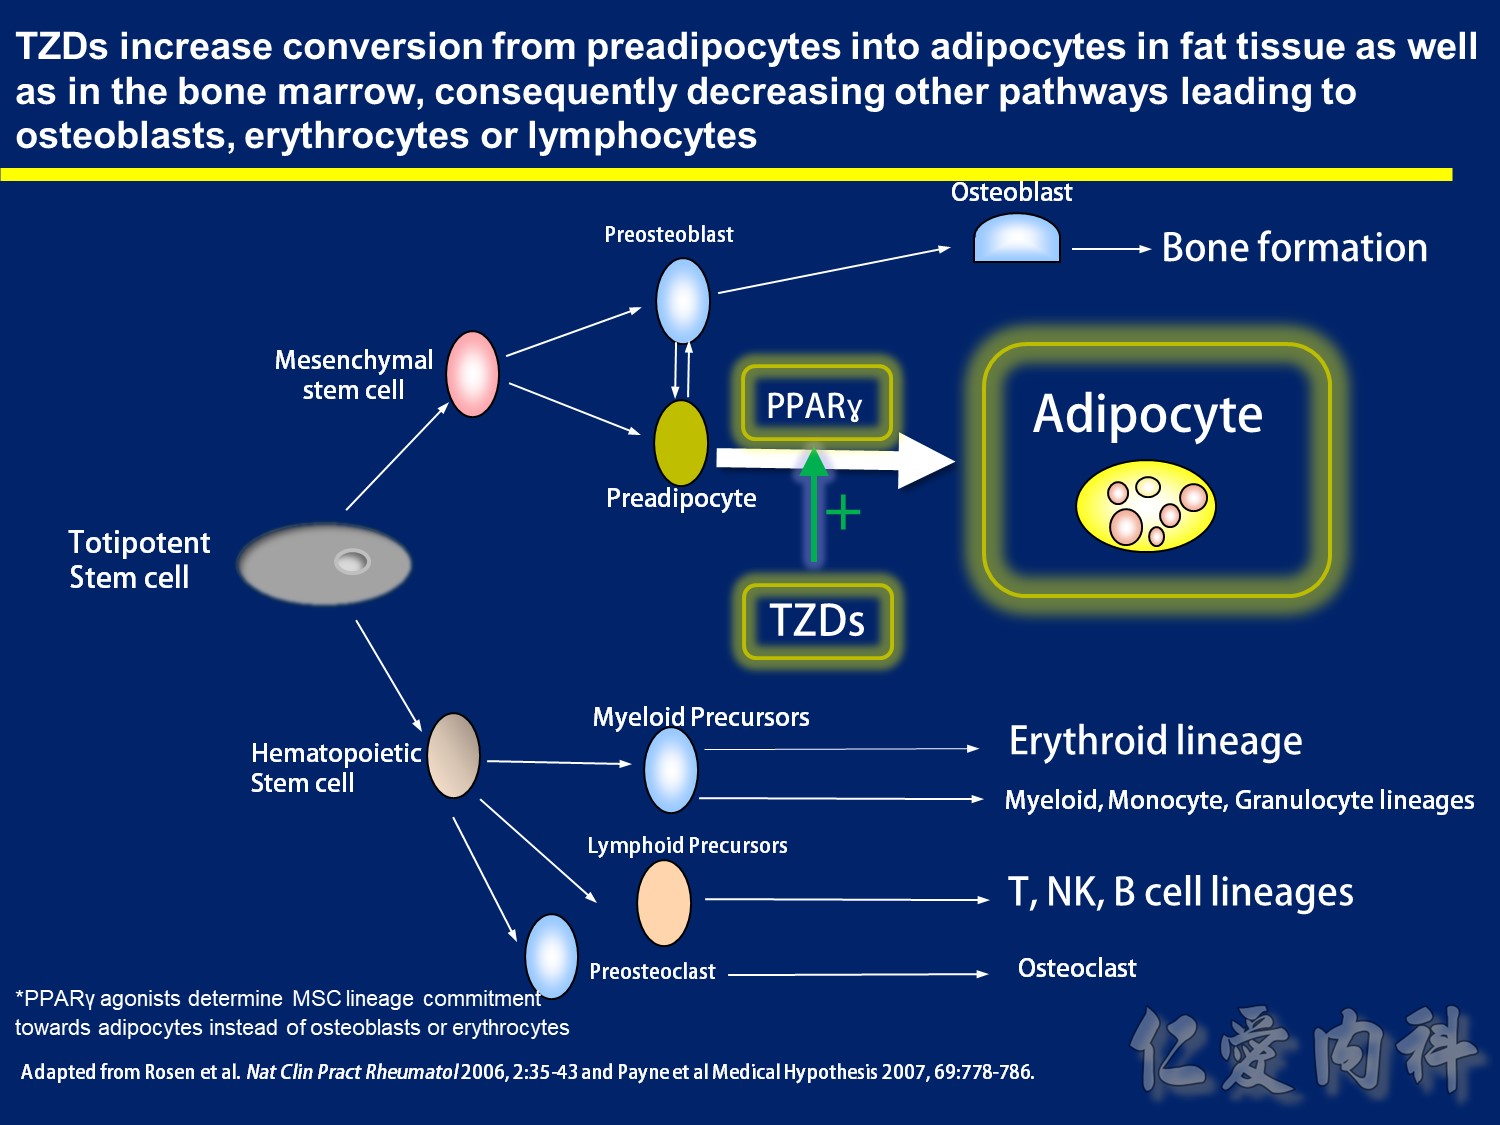
TZDs increase conversion from preadipocytes into adipocytes in fat tissue as well as in the bone marrow, consequently decreasing other pathways leading to osteoblasts, erythrocytes or lymphocytes
-Adipocytes and bone cells (both osteoclasts and osteoblasts) have common origin in bone marrow: totipotent stem cell 1
– Use of TZDs (PPAR gamma agonists) activates preadipocyte differentiation into adipocyte therefore favoring fat deposition
– Consequently this shifts the balance of bone marrow cell differentiation into fat instead of bone-forming osteoblasts
– Importantly, differentiation into erythrocytes and T or B lymphocytes, from hematopoetic stem cell, may also be lower in the face of increased adipocyte formation – this concept is similar to the hypothesis of “anemia of immobility” where physical immobility is linked to increased adipocyte generation at the expense of red blood cells2
References
1.Rosen et al. Mechanisms of Disease: is osteoporosis the obesity of bone? Nat Clin Pract Rheumatol. 2006; 2:35-43
- Payne et al. Anemia of immobility: Caused by adipocyte accumulation in bone marrow. Medical Hypothesis. 2007; 69:778-786

Weight Gain is a Common Side Effect of Diabetes Treatments
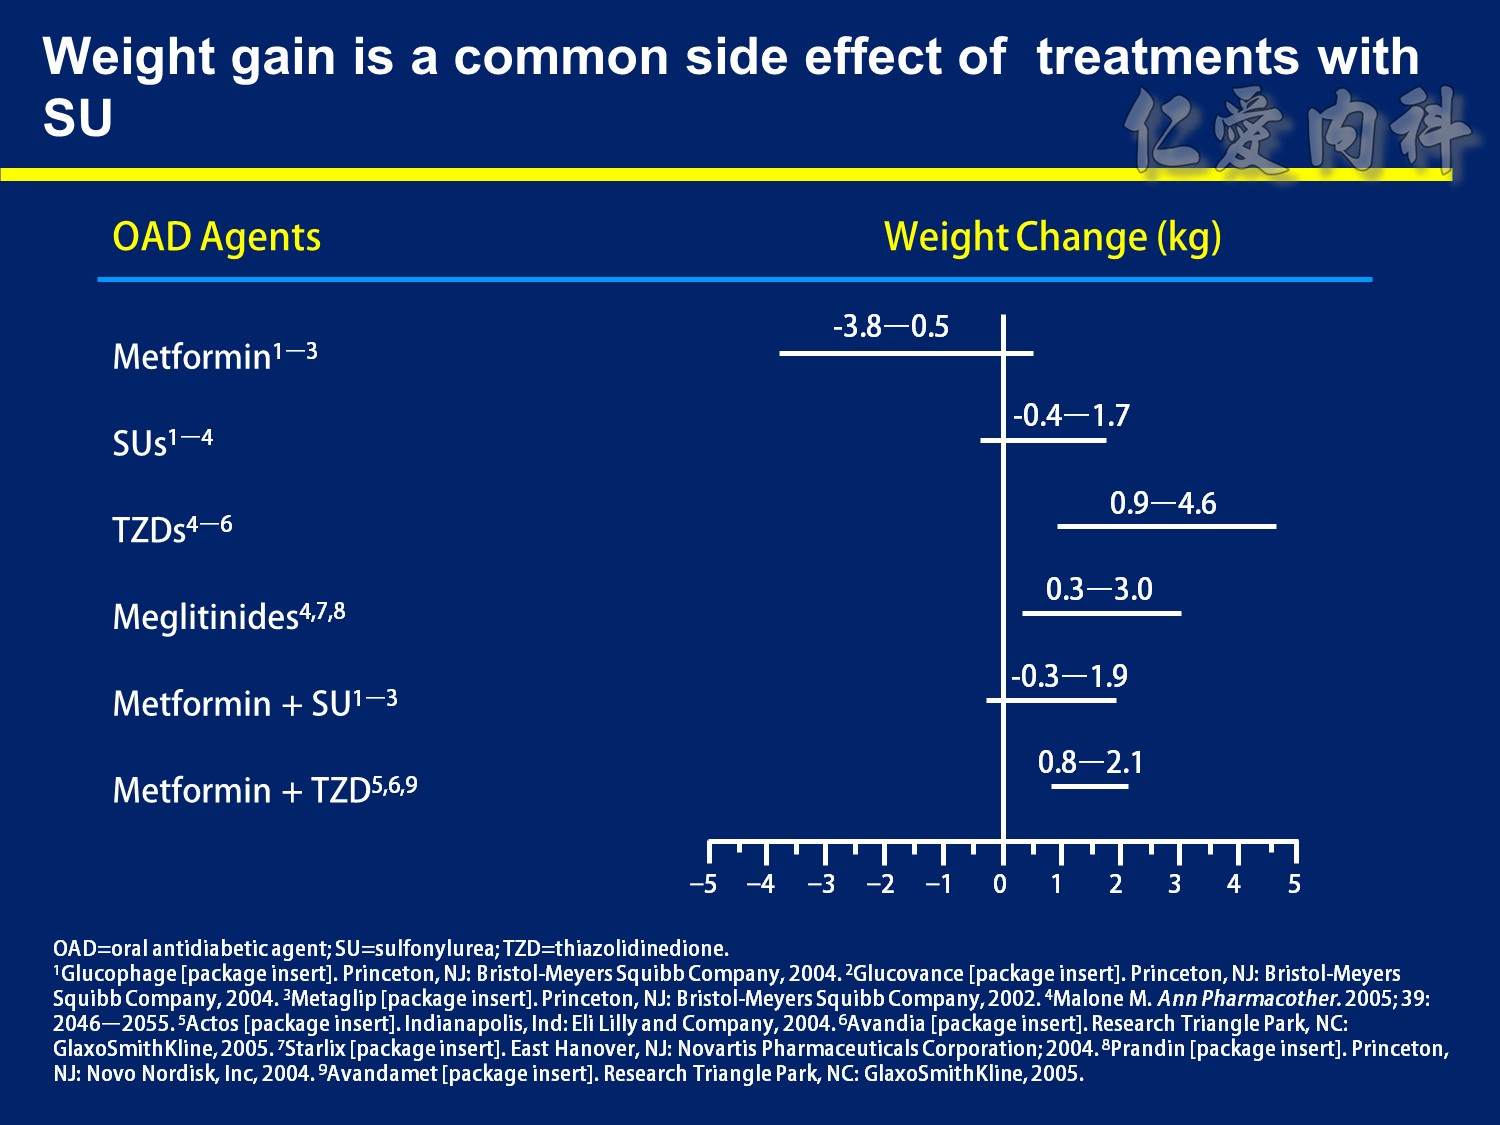
The majority of therapies for type 2 diabetes mellitus (T2DM) cause weight increases—an undesirable effect in a patient population that is generally already overweight. Mechanisms behind the weight gain vary from agent to agent. With the secretagogues, increased insulin levels reverse the catabolic effects of diabetes, leading to increases in weight. Thiazolidinediones (TZDs) increase adipocyte proliferation and also cause fluid retention, both of which can result in weight gain.1–4
By itself, metformin is generally weight neutral or may even yield modest decreases in weight (up to 3.8 kg). However, the sulfonylurea component of the single-pill combinations of metformin with glyburide or glipizide negates metformin’s propensity for weight loss, and weight increases of up to 1.9 kg have been observed.5–7
With the sulfonylureas, weight increases of as much as 1.7 kg have been observed.2,5–7
The weight gain associated with TZDs may be even greater than that associated with sulfonylureas, with observed gains of up to 4.6 kg. When combined with metformin, TZDs also negate metformin’s positive weight effects. Gains up to 2.1 kg have been noted with this combination.2–4,8
Like the sulfonylureas, the meglitinides typically cause weight gain, with increases between 0.3 kg and 3.0 kg.2,9,10
References
1.Inzucchi SE. Oral hypoglycemic therapy for type 2 diabetes. Scientific review. JAMA. 2002; 287: 360–372.
2.Malone M. Medications associated with weight gain. Ann Pharmacother. 2005; 39: 2046–2055.
3.Actos [package insert]. Indianapolis, IN: Eli Lilly and Company; 2004.
4.Avandia [package insert]. Research Triangle Park, NC: GlaxoSmithKline; 2005.
5.Glucophage [package insert]. Princeton, NJ: Bristol-Meyers Squibb Company; 2004.
6.Glucovance [package insert]. Princeton, NJ: Bristol-Meyers Squibb Company; 2004.
7.Metaglip [package insert]. Princeton, NJ: Bristol-Meyers Squibb Company; 2002.
8.Avandamet [package insert]. Research Triangle Park, NC: GlaxoSmithKline; 2005.
9.Starlix [package insert]. East Hanover, NJ: Novartis Pharmaceuticals Corporation; 2004.
10.Prandin [package insert]. Princeton, NJ: Novo Nordisk, Inc; 2004.
DISCUSSION POINTS:
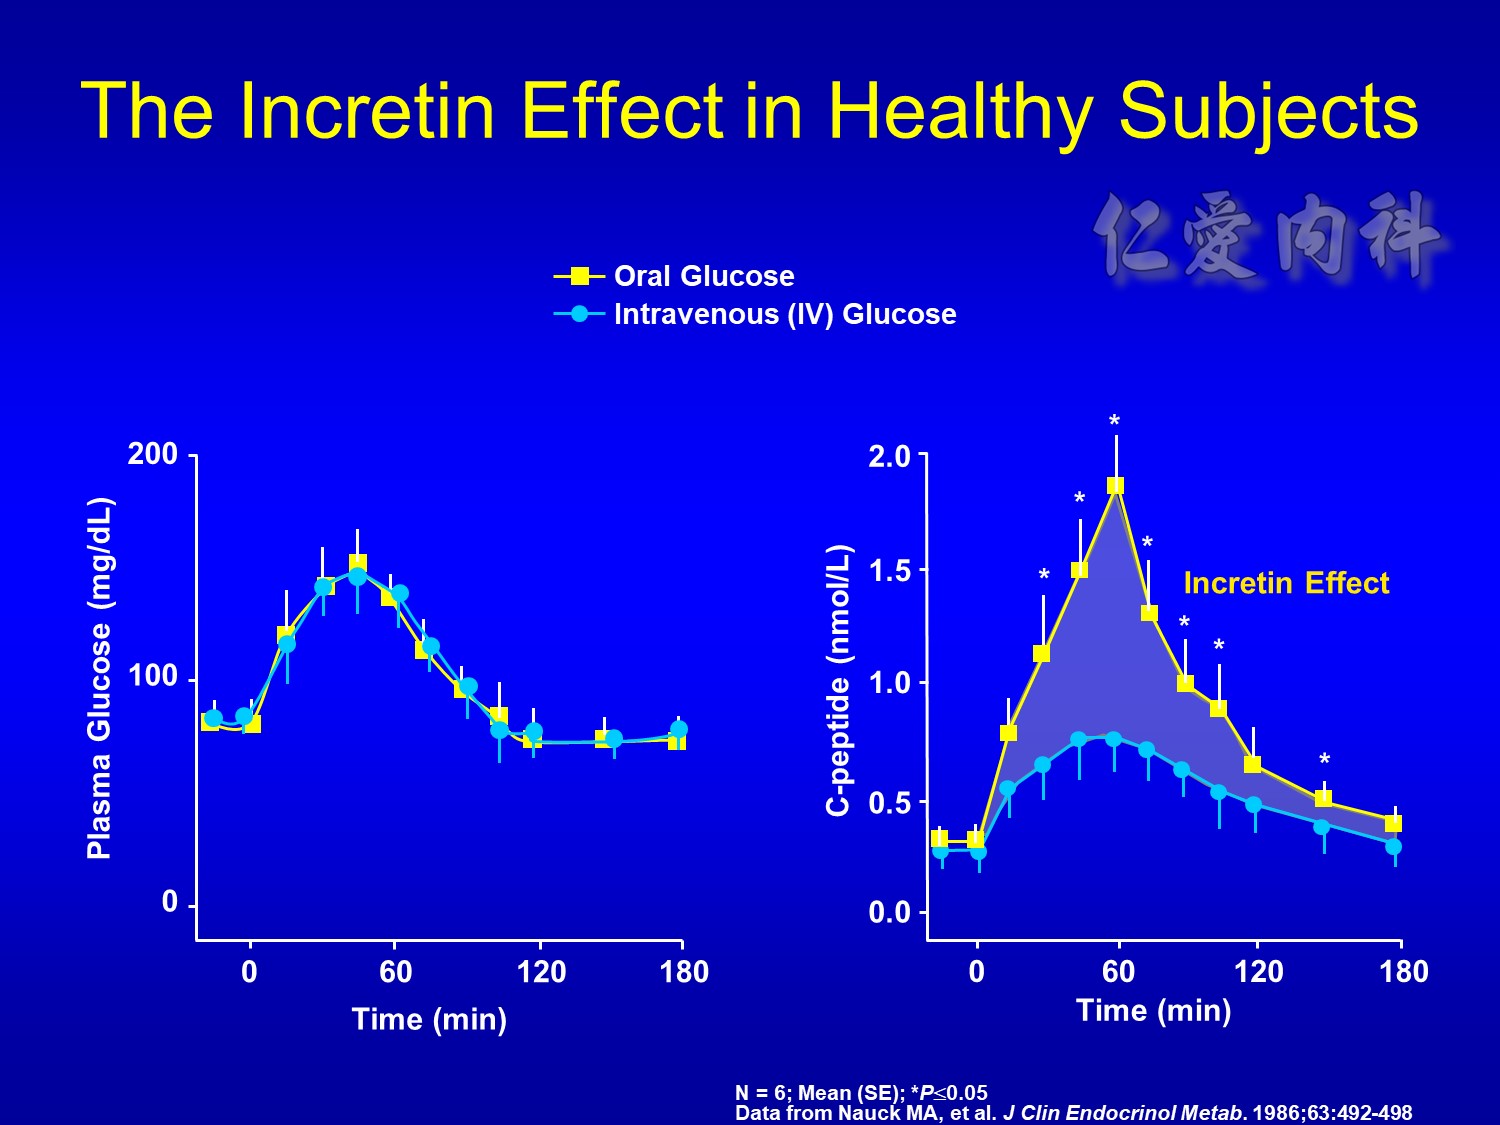
The increasing plasma glucose resulting from ingestion of 50 g oral glucose (white line in left-side graph) results in an increase of C-peptide (a measure of insulin secretion) (white line in right-side graph).
An isoglycemic intravenous glucose infusion designed to mimic the plasma glucose excursion achieved by the oral glucose load was later administered to the same study patients (orange line in left-side graph). The resulting beta-cell response, measured as C-peptide, is shown on the right-side graph.
Despite the same plasma glucose profiles, there are significant differences in the beta-cell response, as measured by C-peptide.
This difference prompted study into the role of incretins – factors secreted from the intestinal tract, upon the ingestion of food, that enhance the secretion of insulin – that would account for the greater insulin response to oral glucose.
This incretin effect suggested that incretins, and not merely the direct actions of plasma glucose, affect the insulin secretory response.
SLIDE BACKGROUND:
Young healthy subjects (n = 6), given 50 g oral glucose load or isoglycemic intravenous glucose infusion.
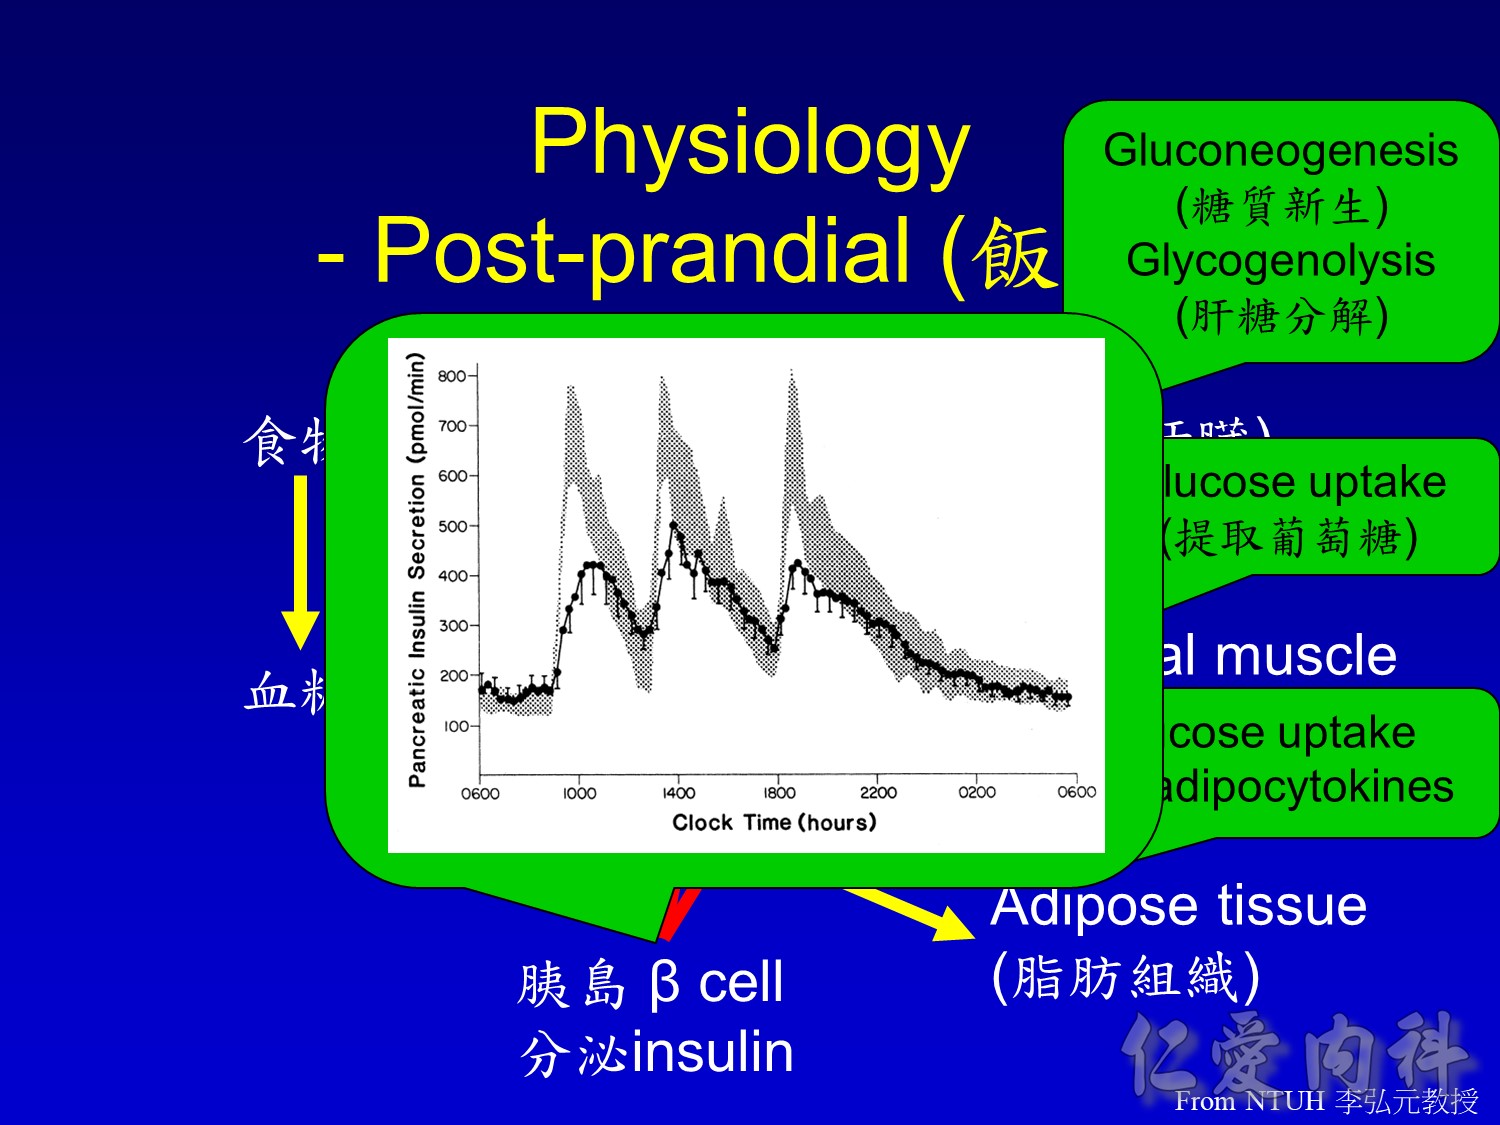
Food elicits dynamic changes in insulin secretion, beginning with the cephalic phase, in which anticipation of a meal results in CNS-mediated release of insulin. An early prandial phase, mediated by gut-derived incretin hormones (e.g., GLP-1 and GIP) occurs after food intake but before the ingested nutrients appear in the circulation (or reach the intestinal L cells that secrete GLP-1).
Cleavage of proinsulin generates both insulin and the C-peptide, which are stored together and cosecreted. Therefore, C-peptide serves as a marker for insulin secretion.
Major discussion point:
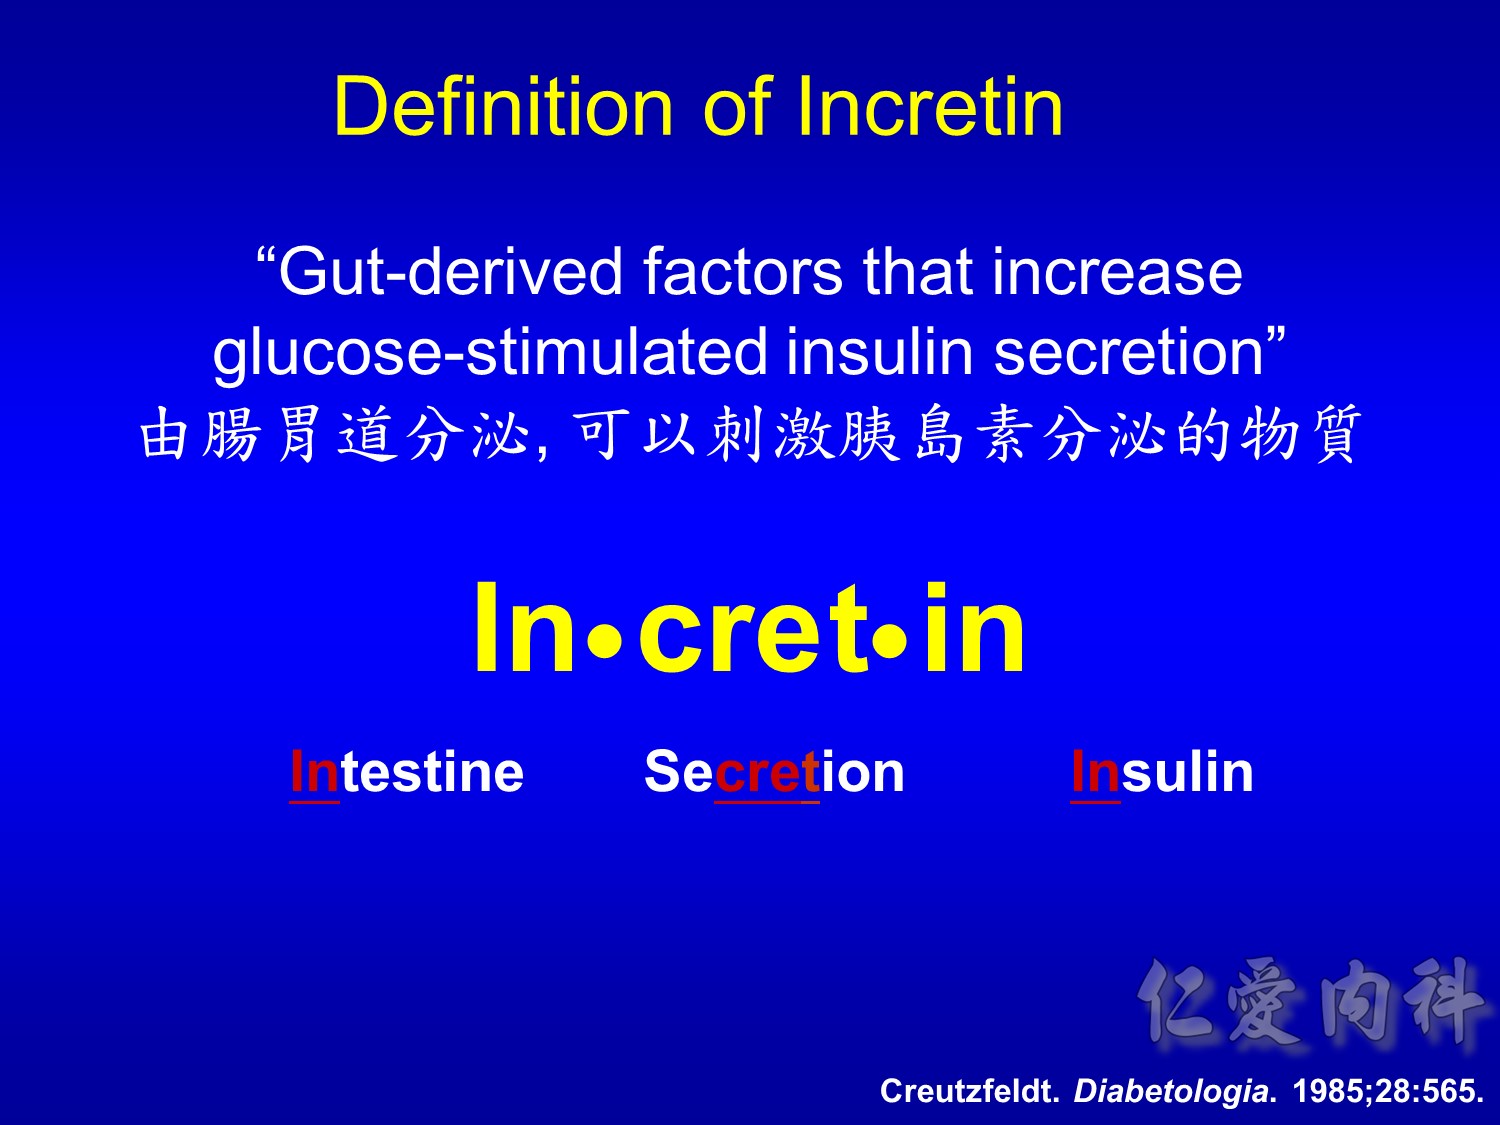
INtestine
SeCRETion
INsulin
Creutzfeldt W, Ebert R. New developments in the incretin concept. Diabetologia. 1985;28:565-573.
Major discussion point:
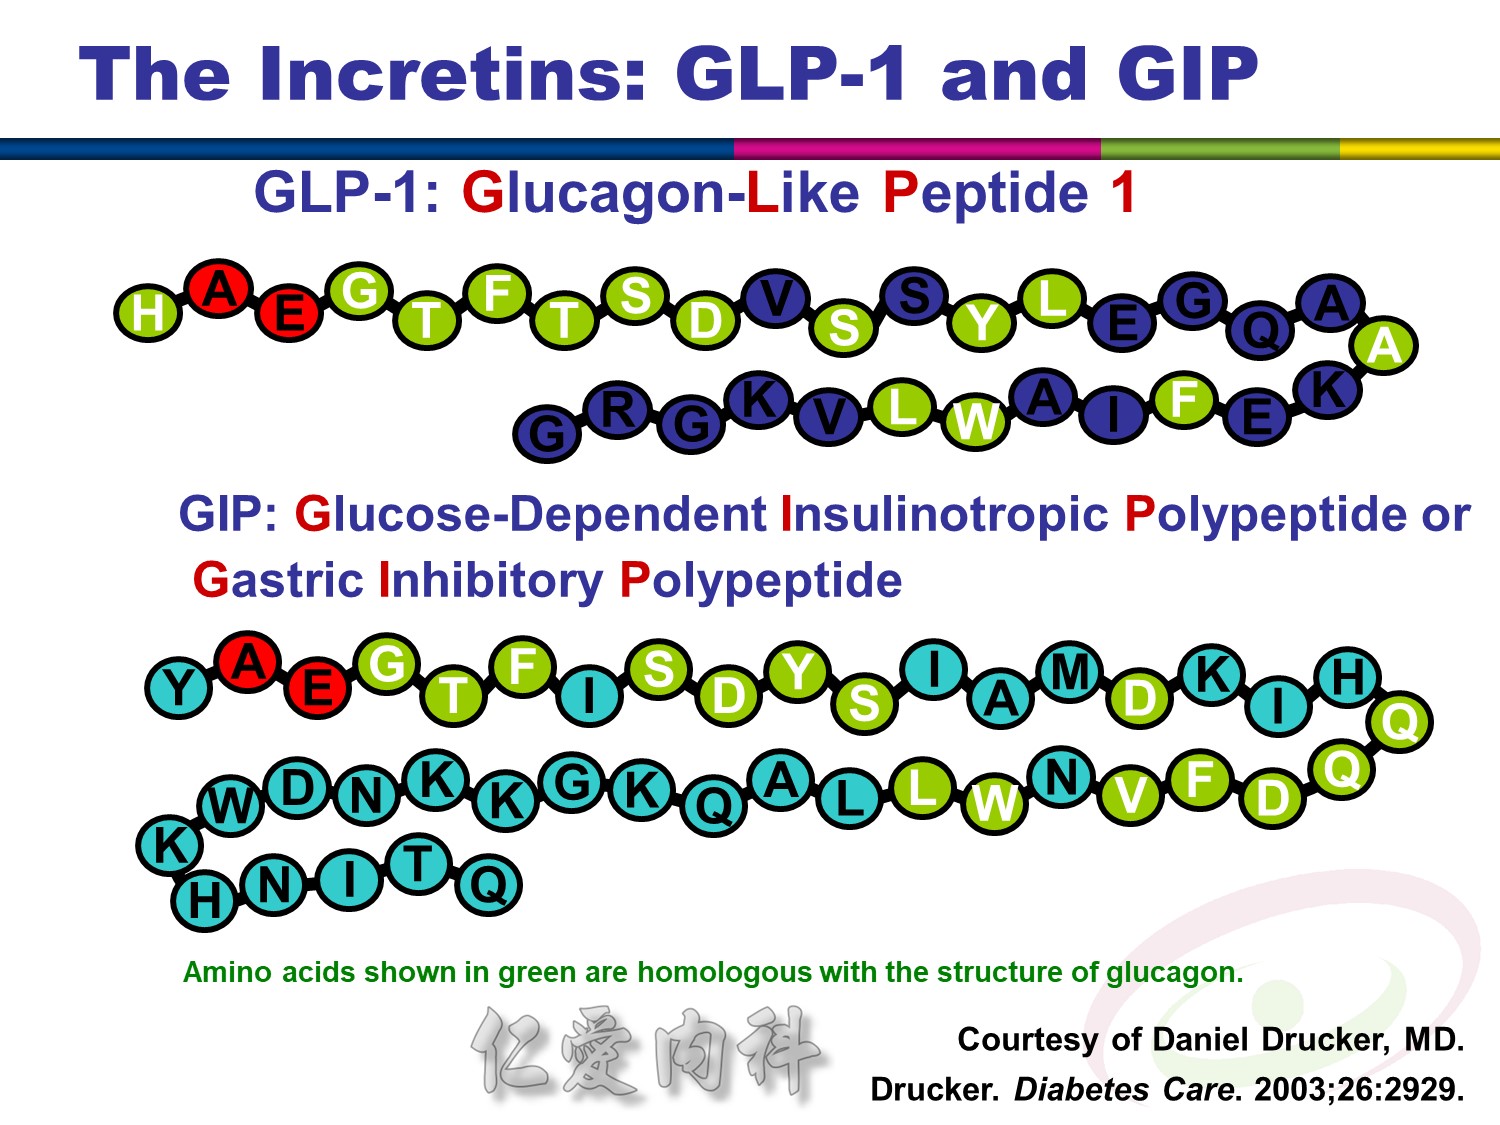
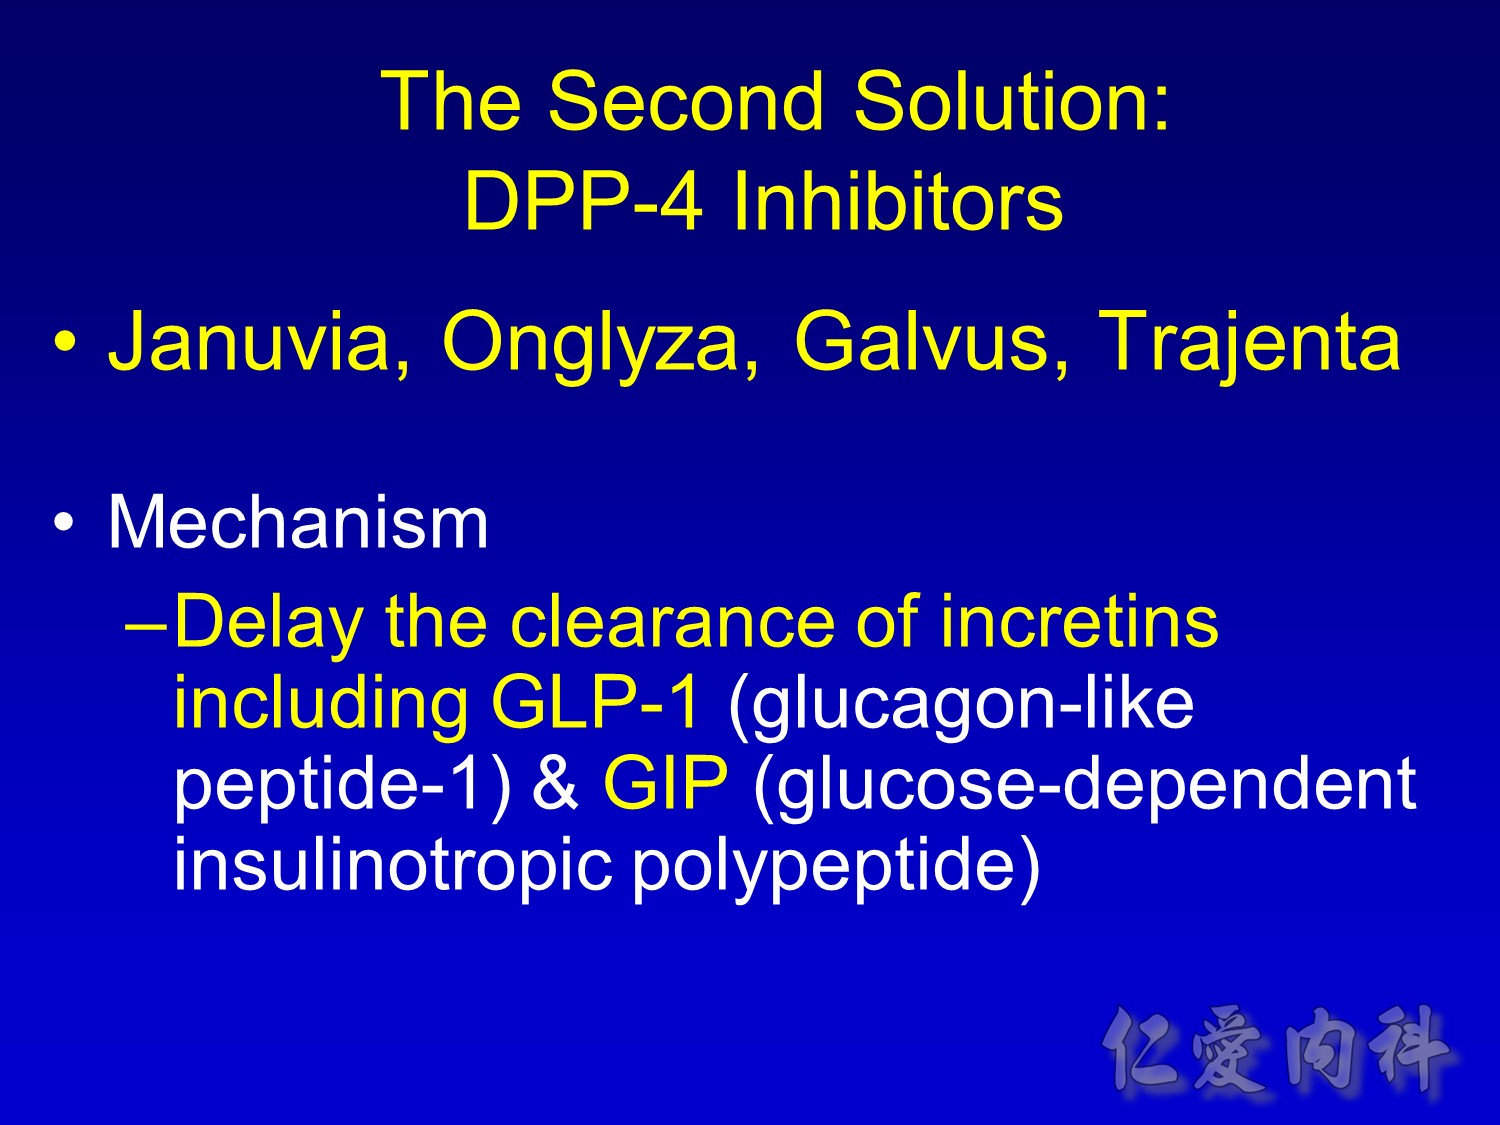
There have been 2 important incretins identified thus far: GLP-1 (glucagon-like peptide 1) and GIP (originally “gastric inhibitory polypeptide,” but it was later determined that GIP did not inhibit gastric function and the name was changed to “glucose-dependent insulinotropic polypeptide,” retaining the GIP acronym).
Both of these peptides share amino acid sequences similar to those found in glucagon.
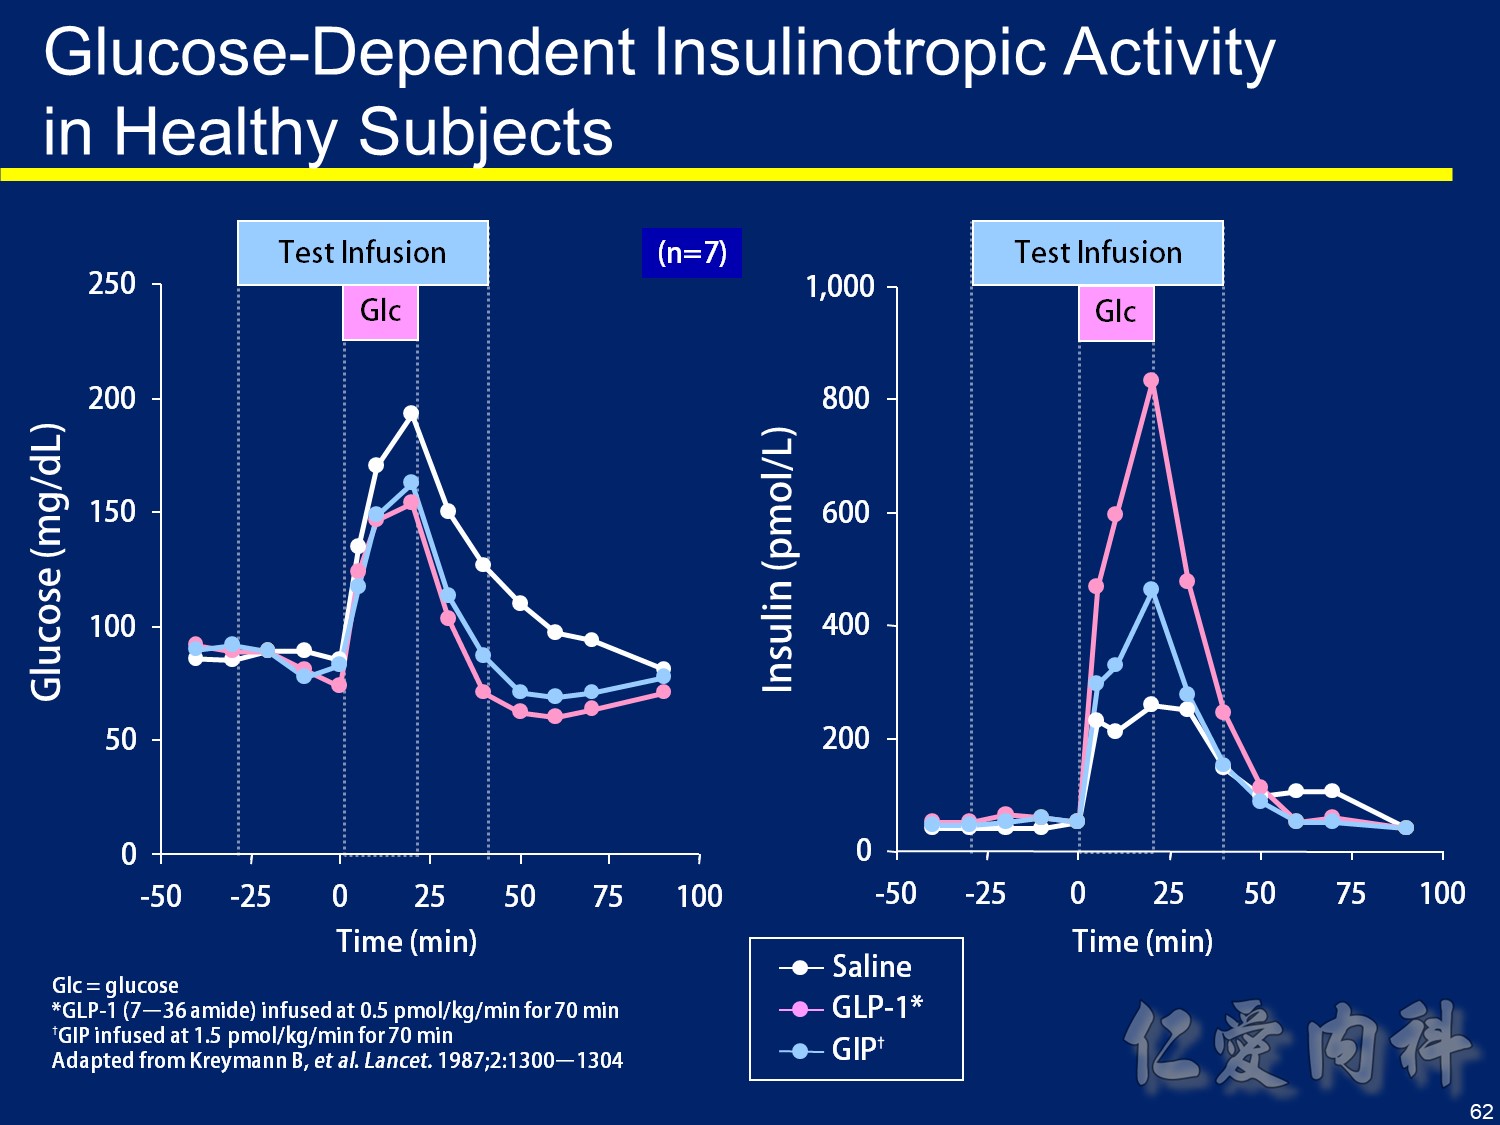
Glucose在0 min打 GLP-1及GIP組血糖下降比較快 且血糖只會下降到正常 不會到低血糖
右圖可見 在GLP及GIP組 insulin上生的量較大 且血糖正常後 insulin濃度就下降了
An oral glucose load results in a greater insulin response than the response caused by an intravenous glucose load matched to produce a similar glycemic profile. This phenomenon is termed “the incretin effect” because it is attributable
to the release of incretin hormones that occurs after oral but not intravenous administration of glucose.1-3
Studies in humans and animal models have shown that the incretin hormones
GLP-1 and GIP are believed to account for almost the entire incretin effect that facilitates disposal of ingested nutrients.2
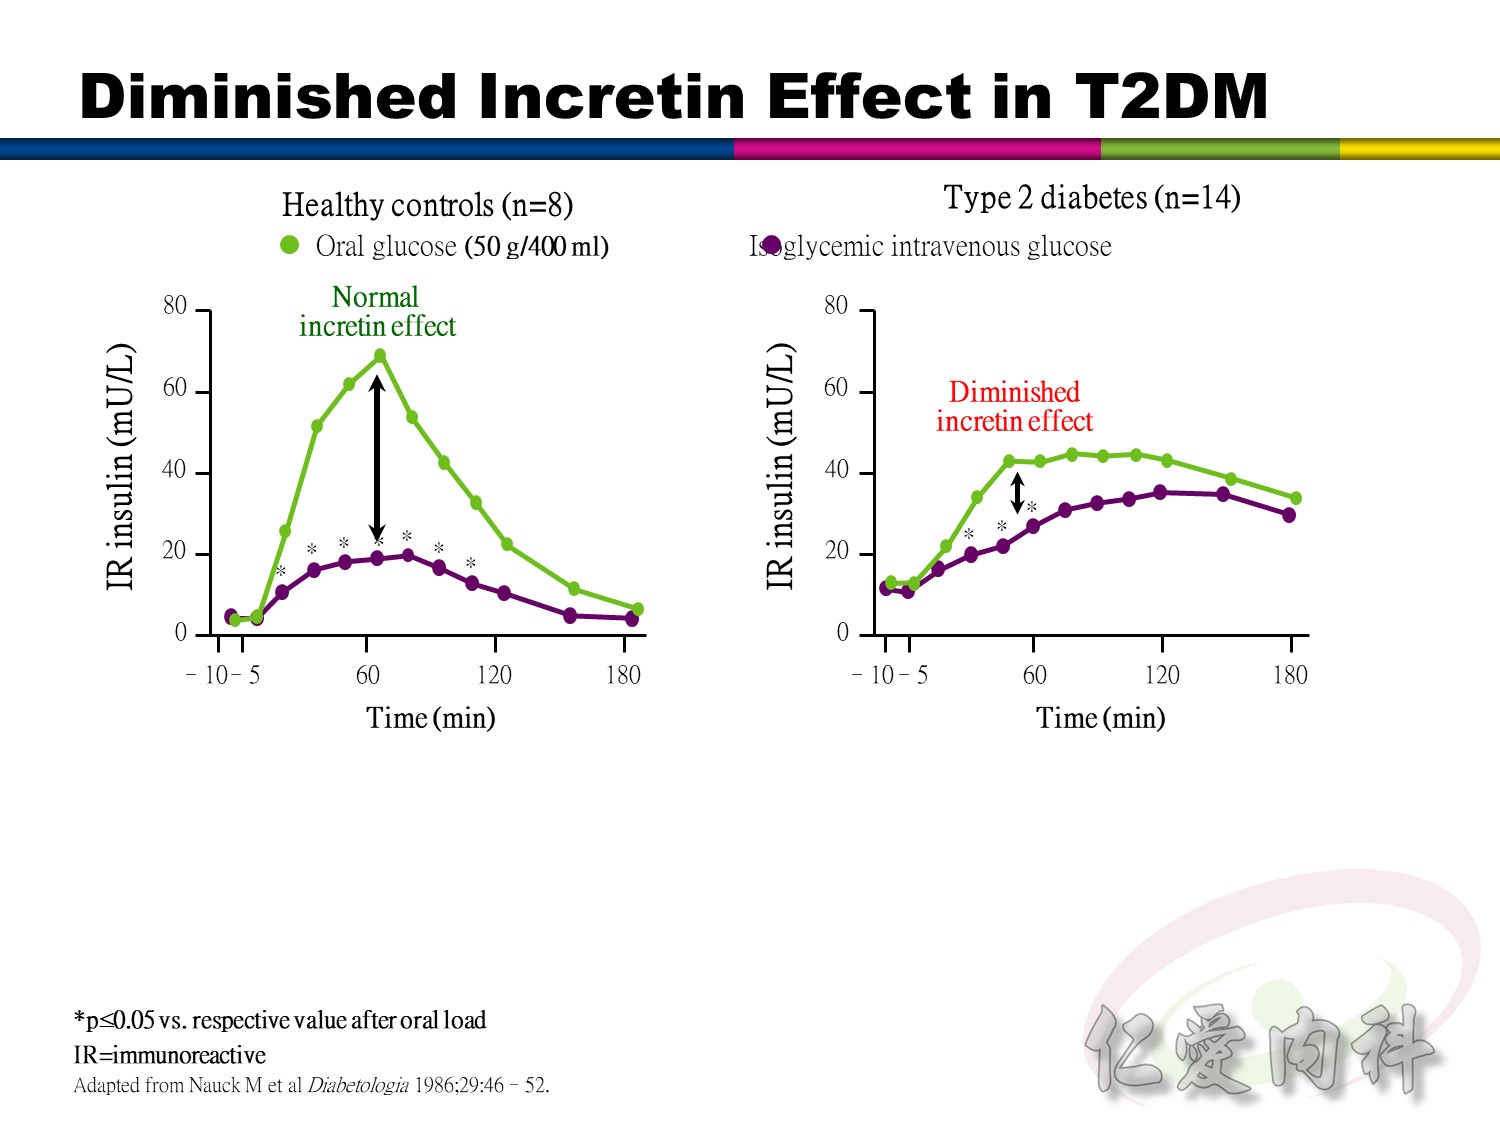
A clinical study showed that the incretin effect was diminished in patients with
type 2 diabetes (n=14) compared with metabolically healthy control subjects (n=8).4
As shown on the graphs, glucose profiles were closely mimicked at similar levels after oral versus intravenous glucose administration.4 This matching of intravenous glucose loads to oral glucose loads after ingestion was achieved in both control subjects and patients with diabetes.4
Beta-cell secretory responses, reflected by increases in plasma levels of immunoreactive (IR) insulin, are shown on the bottom graphs in the slide. These graphs show that plasma IR insulin peaks were delayed and diminished in patients with type 2 diabetes. Although insulin levels were greater after oral glucose ingestion versus intravenous administration in both groups, the incretin effects were markedly less pronounced in diabetic patients.4
An oral glucose load results in a greater insulin response than the response caused by an intravenous glucose load matched to produce a similar glycemic profile. This phenomenon is termed “the incretin effect” because it is attributable
to the release of incretin hormones that occurs after oral but not intravenous administration of glucose.1-3
Studies in humans and animal models have shown that the incretin hormones
GLP-1 and GIP are believed to account for almost the entire incretin effect that facilitates disposal of ingested nutrients.2
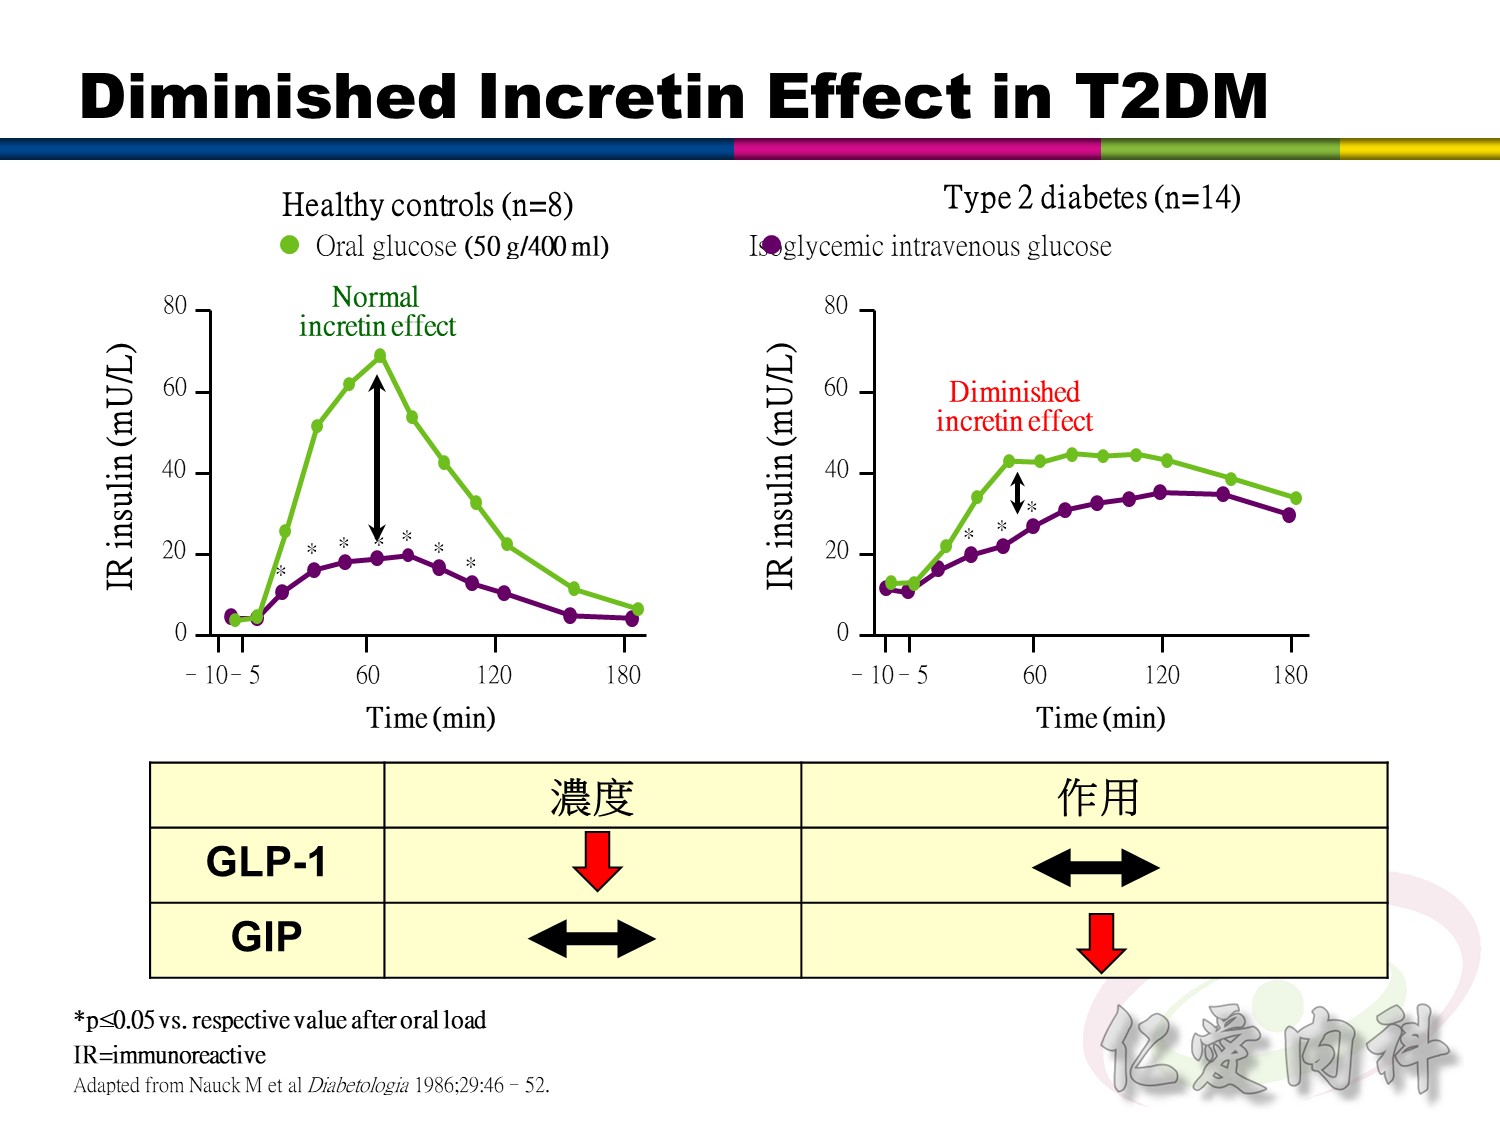
A clinical study showed that the incretin effect was diminished in patients with
type 2 diabetes (n=14) compared with metabolically healthy control subjects (n=8).4
As shown on the graphs, glucose profiles were closely mimicked at similar levels after oral versus intravenous glucose administration.4 This matching of intravenous glucose loads to oral glucose loads after ingestion was achieved in both control subjects and patients with diabetes.4
Beta-cell secretory responses, reflected by increases in plasma levels of immunoreactive (IR) insulin, are shown on the bottom graphs in the slide. These graphs show that plasma IR insulin peaks were delayed and diminished in patients with type 2 diabetes. Although insulin levels were greater after oral glucose ingestion versus intravenous administration in both groups, the incretin effects were markedly less pronounced in diabetic patients.4
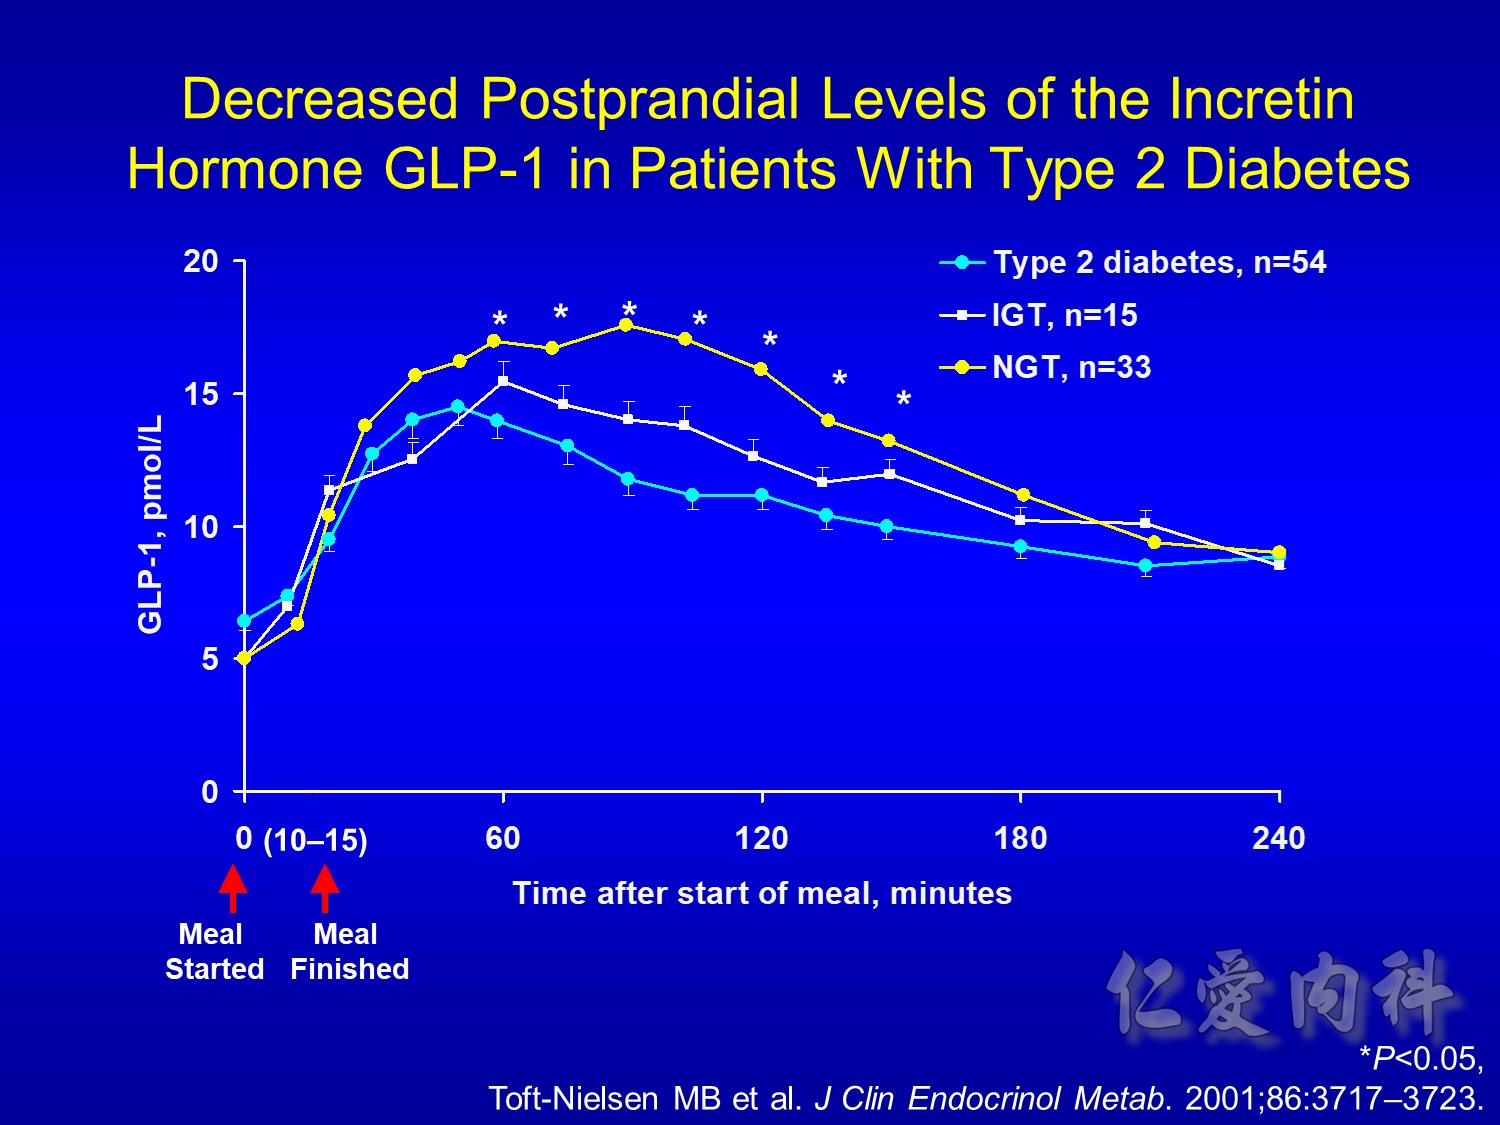
Decreased Postprandial Levels of the Incretin Hormone GLP-1 in Patients With
Type 2 Diabetes
Speaker notes
This clinical study investigated the meal-stimulated GLP-1 response (shown in the slide) and GIP response (not shown) in patients with type 2 diabetes (n=54) vs subjects with IGT (n=15), and control subjects with NGT (n=33).
After 3 days without antidiabetic medication and after an overnight fast, subjects consumed a mixed meal and underwent blood sampling periodically for 4 hours. The meal was started at time zero and finished within 10 to 15 minutes.
The plasma GLP-1 concentrations for patients with type 2 diabetes vs subjects with IGT and control subjects with NGT are shown on the slide. Postprandial GLP-1 concentrations were significantly decreased in patients with type 2 diabetes compared with those in control subjects with NGT (P<0.05). Concentrations were also decreased in subjects with IGT compared with those in control subjects with NGT. The GLP-1 concentrations of the IGT group ranged between those of patients with type 2 diabetes and control subjects with NGT.
DISCUSSION POINTS:
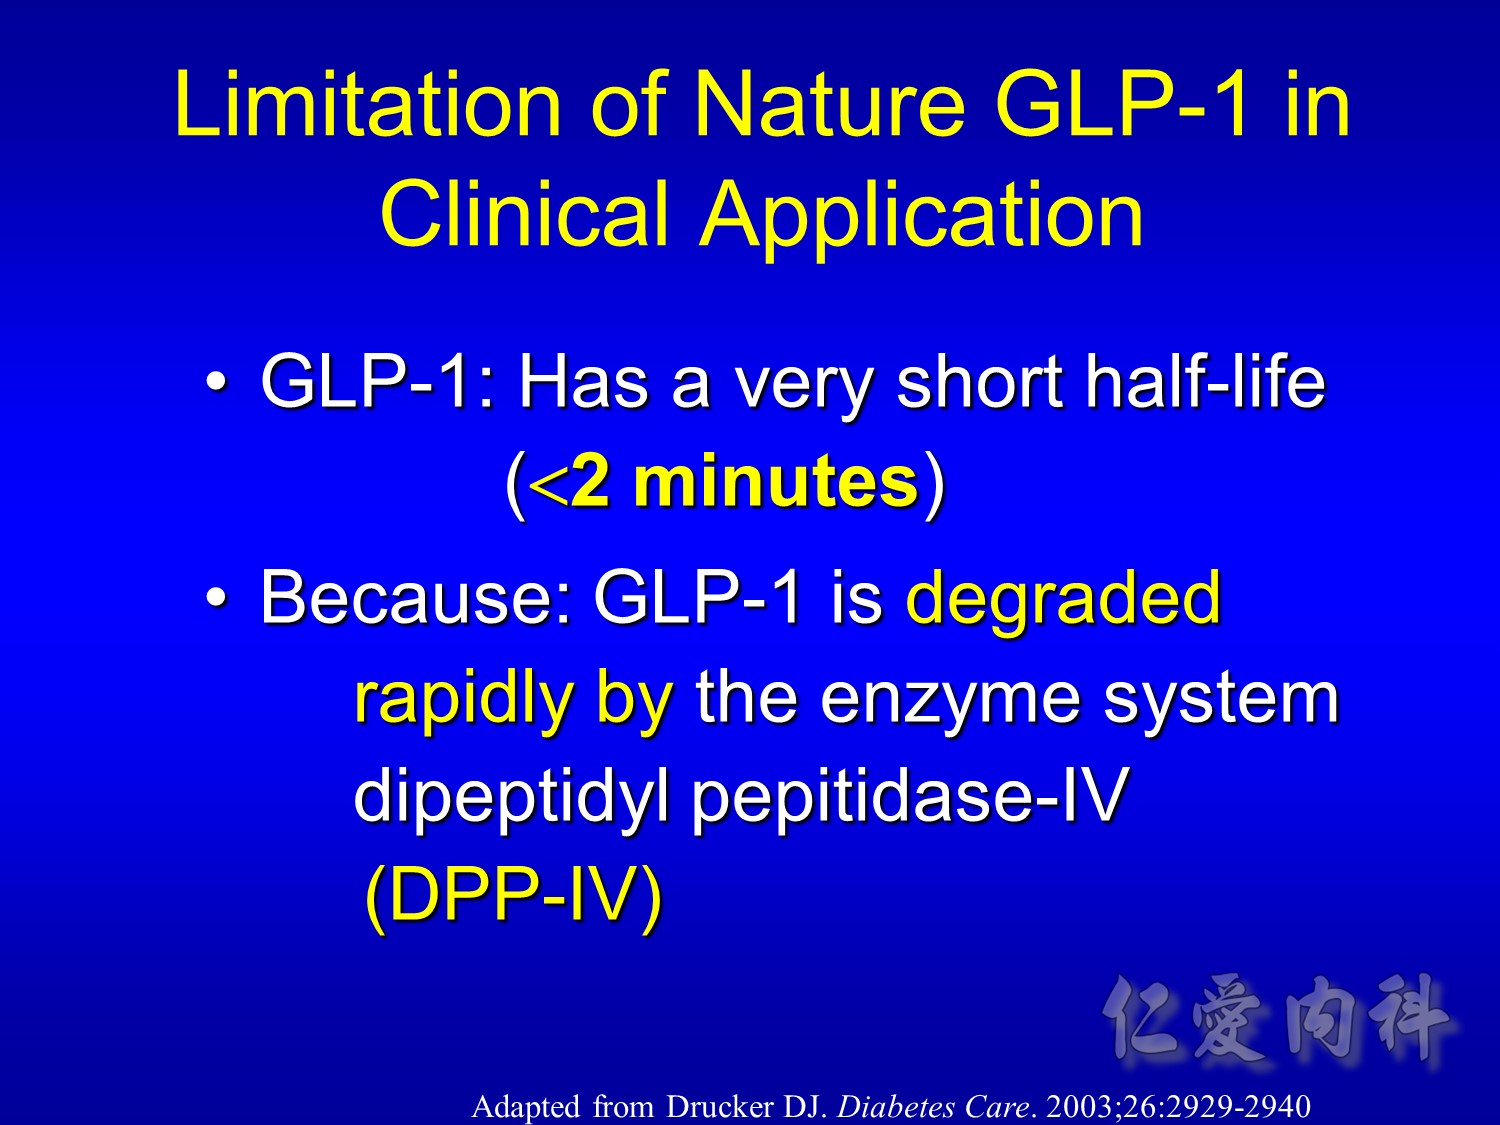
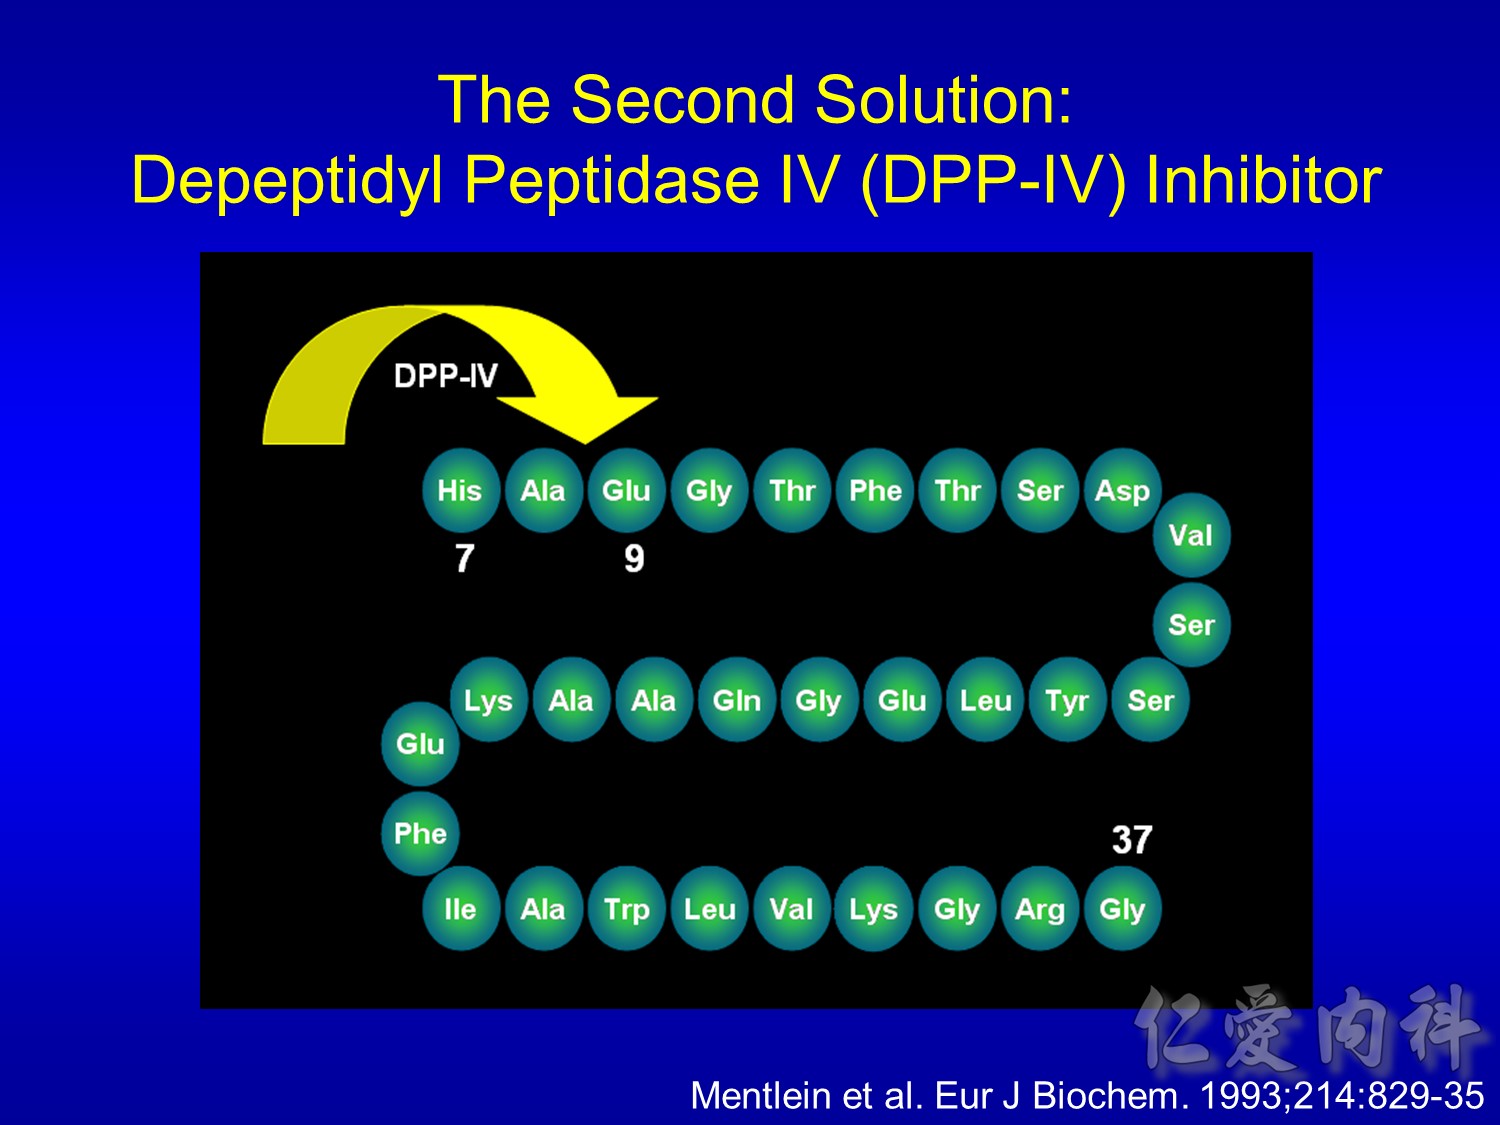
The half-life of GLP-1 is less than 2 minutes – meaning a continuous infusion of exogenous
GLP-1 would be necessary to overcome the enzymatic degradation of GLP-1 by DPP-IV.
Inhibition of DPP-IV, which would extend the half-life of endogenous GLP-1, is one avenue of research.
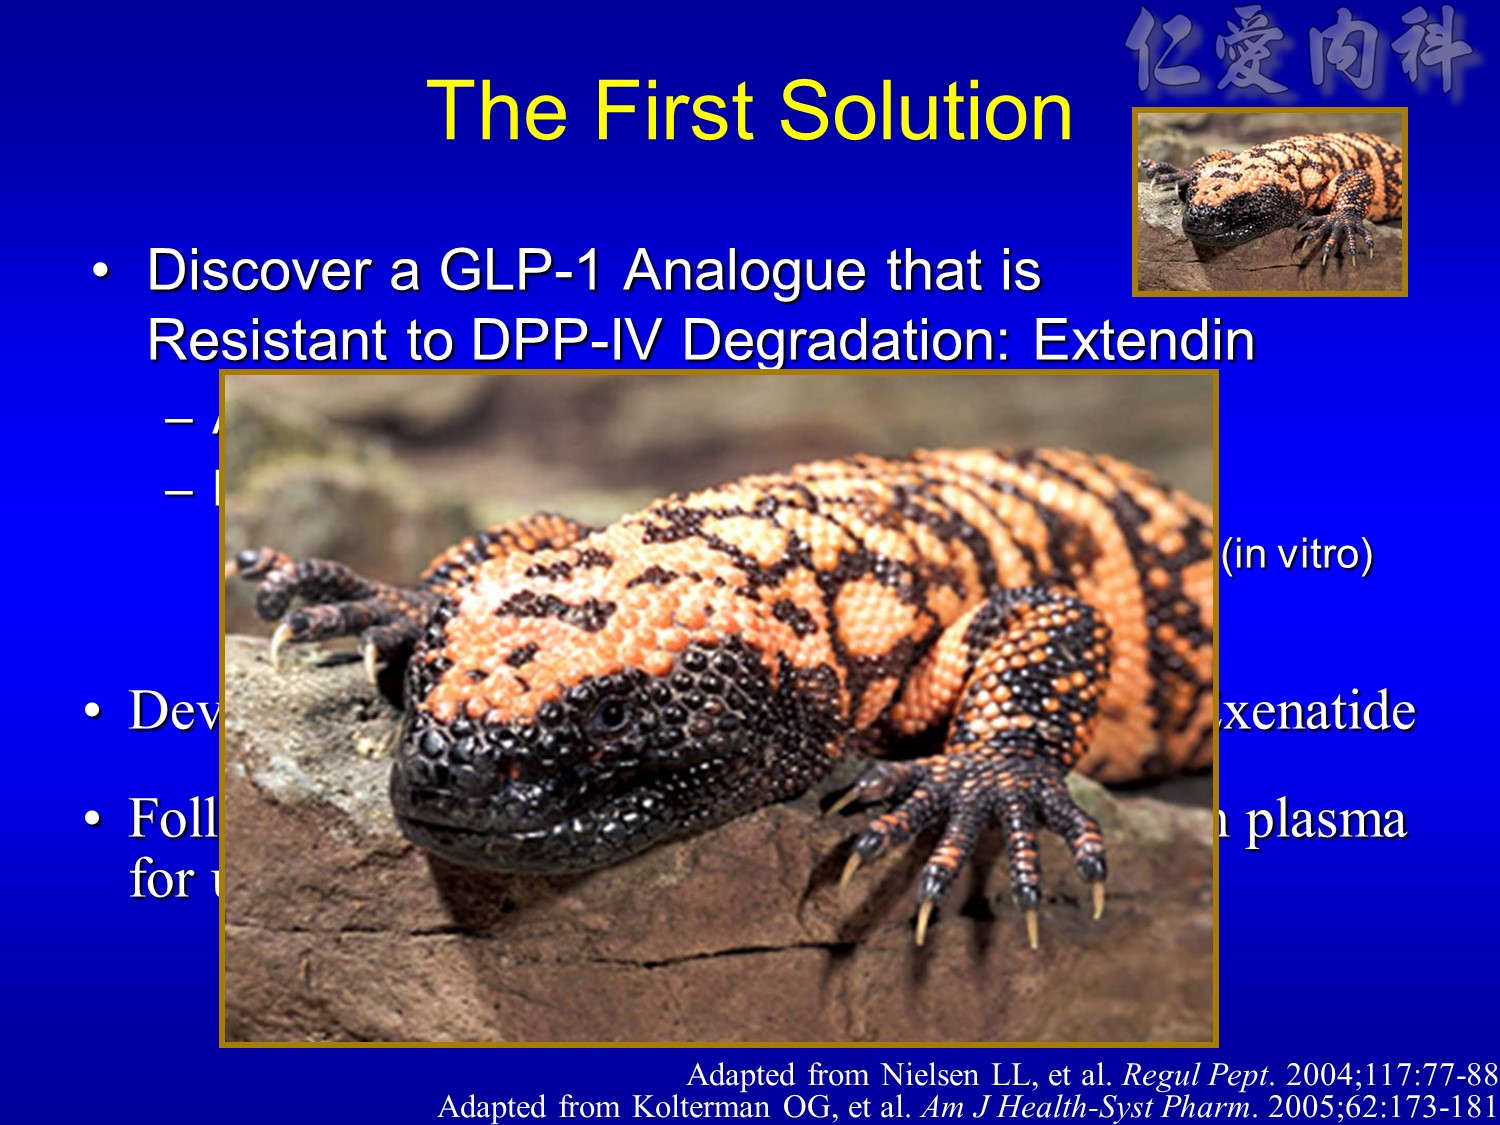
Incretin mimetics are compounds that mimic GLP-1’s glucoregulatory effects, but are resistant to DPP-IV degradation. Examples are:
Analogs of the natural GLP-1 molecule.
Exenatide, a naturally occurring incretin mimetic that mimics multiple glucoregulatory effects of GLP-1 and is resistant to DPP-IV enzymatic degradation, is the first FDA-approved incretin mimetic. The active ingredient is exenatide.
DISCUSSION POINTS:
Exenatide, which was discovered in the salivary secretions of the Gila monster, has 53% amino acid sequence identity with mammalian GLP-1.
Exenatide binds in vitro to the known human GLP-1 receptors on beta cells and mimics multiple glucoregulatory effects of GLP-1.
The amino acid at position 2, the site of DPP-IV inactivation on the GLP-1 molecule, is different in exenatide – making exenatide resistant to DPP-IV enzymatic degradation.
After a single SC injection, exenatide can be measured in the plasma for up to 10 hours.
SLIDE BACKGROUND:
Following exenatide SC administration to patients with type 2 diabetes, exenatide reaches median peak plasma concentrations in 2.1 hours.
The mean terminal half-life of exenatide is 2.4 hours. Pharmacokinetic characteristics of exenatide are independent of the dose. In most individuals, exenatide concentrations are measurable for approximately 10 hours post-dose.
Main Points:
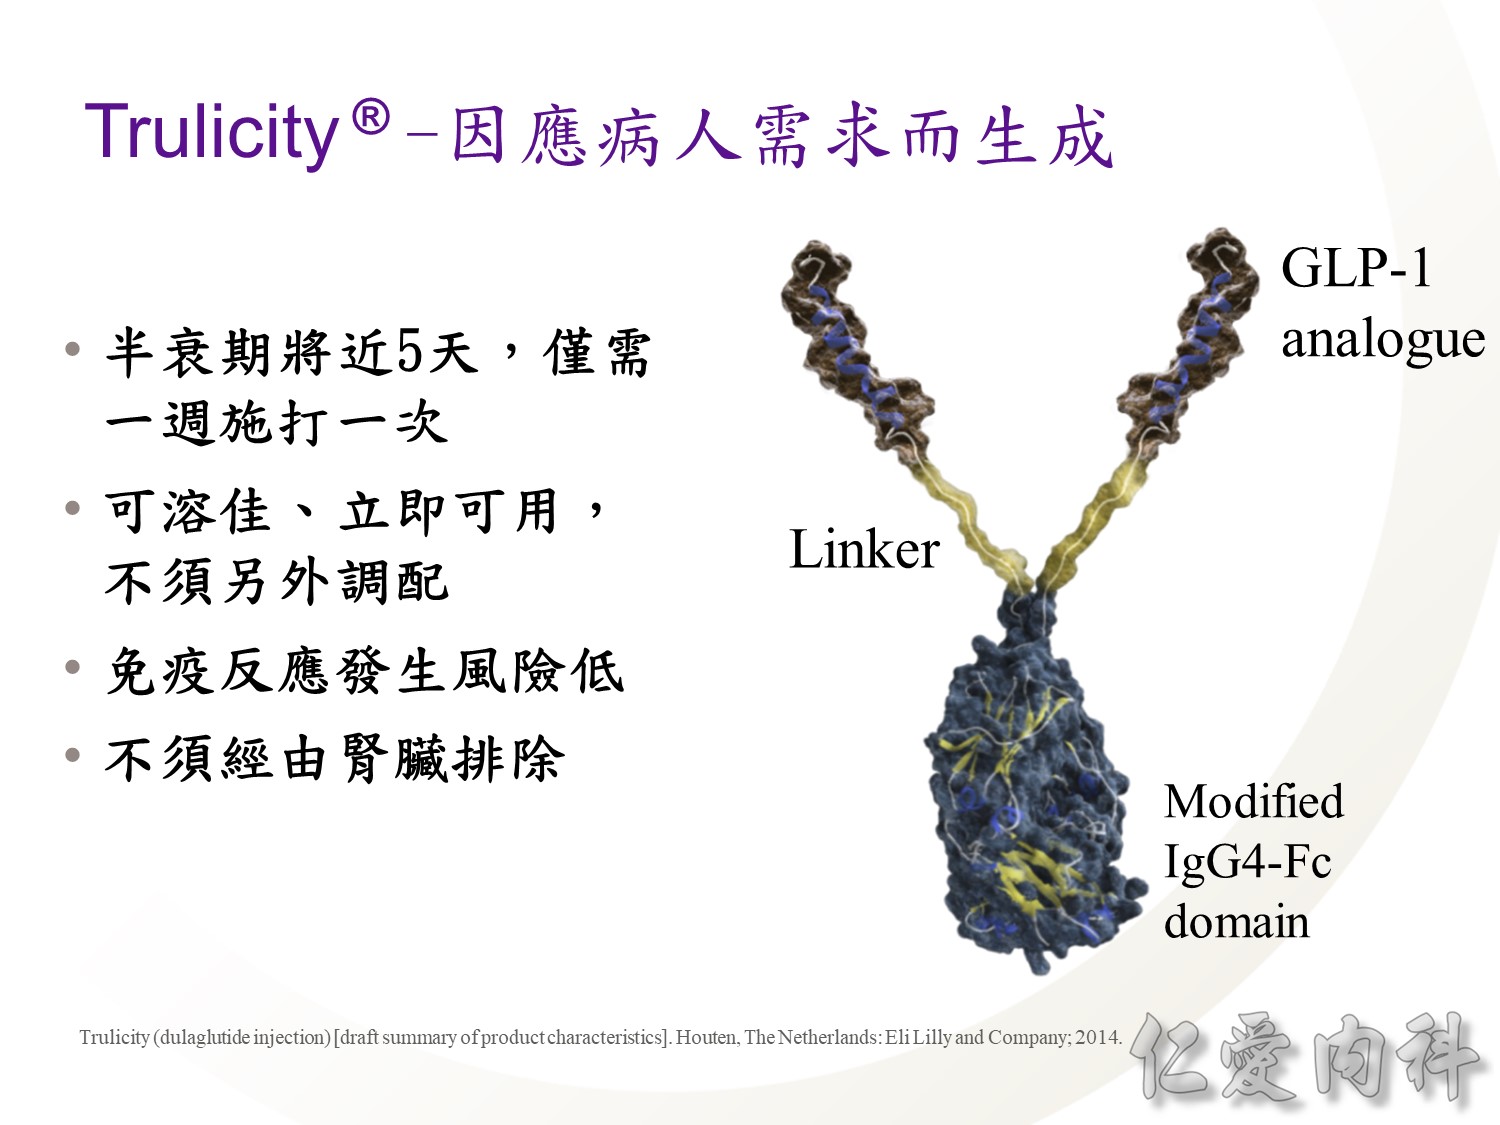
- The goals of Trulicity molecular development were to:
- Offer extended incretin activity to allow once-weekly administration1
- Be very soluble to eliminate the need for reconstitution, providing a ready-to-use formulation and allowing delivery via a small-gauge needle1,2
- Have low potential for immunogenicity3
- These goals were achieved through the molecular engineering of Trulicity allowing that Trulicity:
- Is administered once weekly3
- Does not require reconstitution4
- Is delivered via a small-gauge needle1
- Has low immunogenicity3
- In clinical studies, treatment with Trulicity was associated with a 1.6% incidence of treatment-emergent dulaglutide anti-drug antibodies
- This result indicates that the structural modifications in the GLP-1 and modified IgG4 parts of the Trulicity molecule, together with high homology with native GLP-1 and native IgG4, minimise the risk of immune response against dulaglutide
References:
1.Data on file [Wolfgang Glaesner interview transcript 1]. Indianapolis, IN: Eli Lilly and Company; 2014.
2.Czajkowsky DM, Hu J, Shao Z, Pleass RJ. Fc-fusion proteins: new developments and future perspectives. EMBO Mol Med. 2012;4(10):1015-1028.
3.Trulicity (dulaglutide injection) [summary of product characteristics]. Houten, The Netherlands: Eli Lilly and Company; 2014.
4.Trulicity [instructions for Use]. Houten, The Netherlands: Eli Lilly and Company; 2014.
DISCUSSION POINTS:
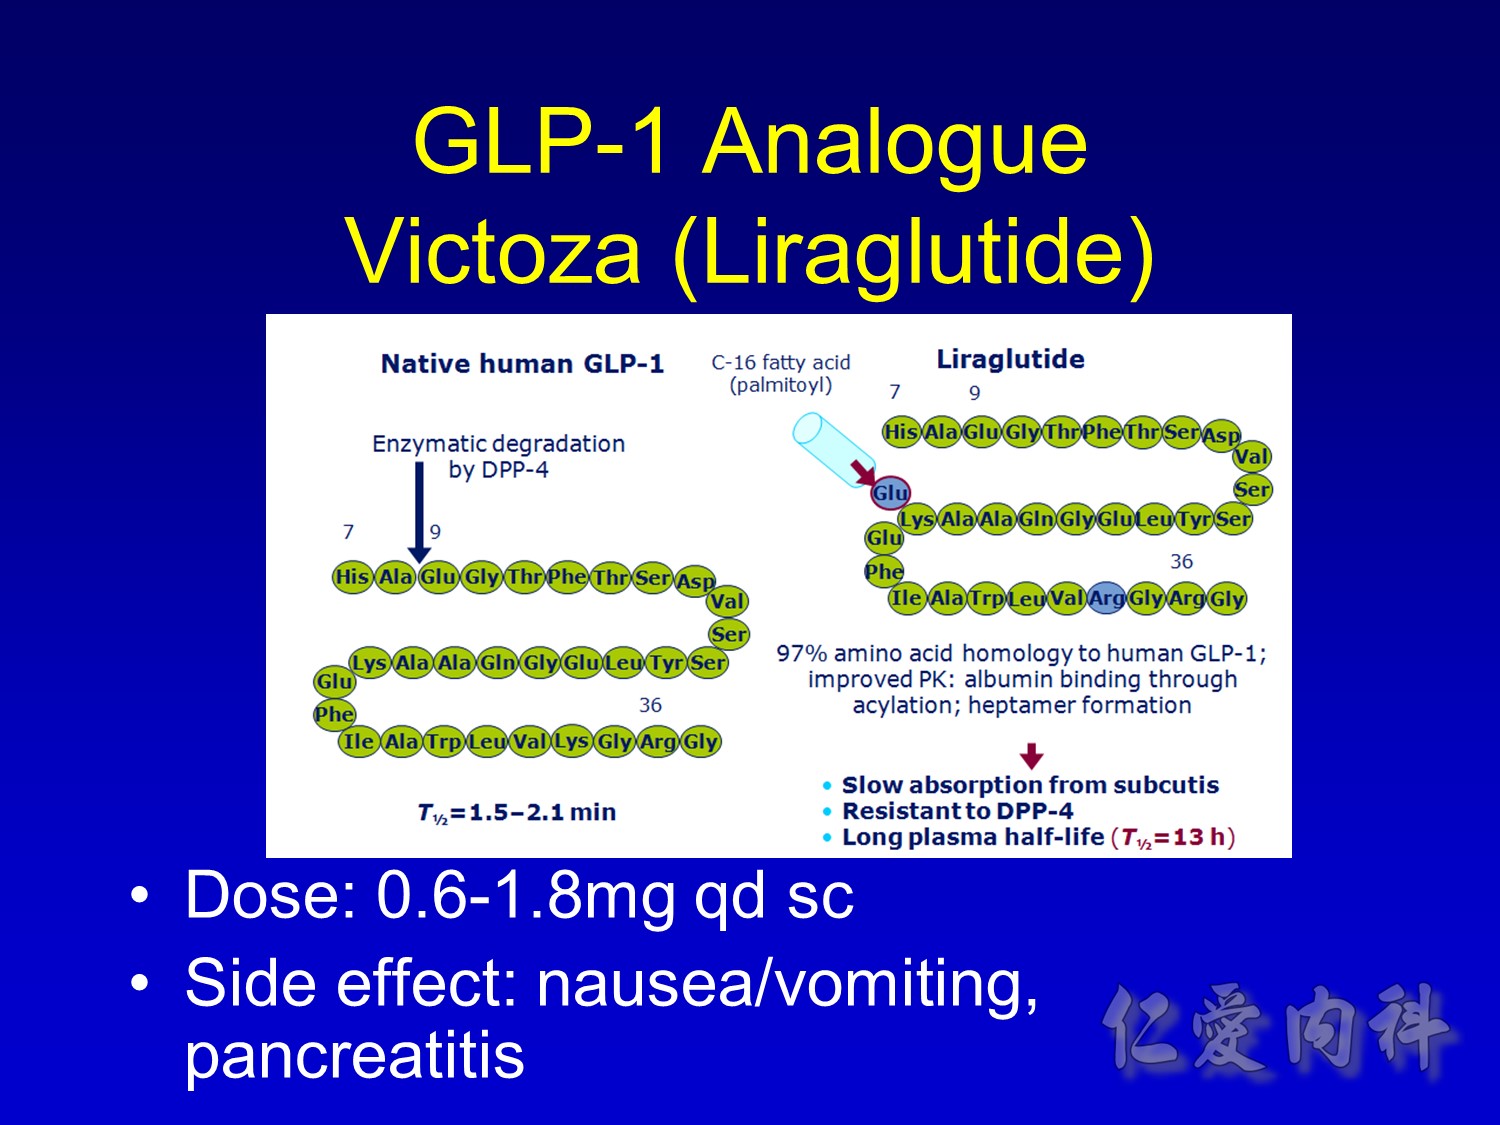
GLP-1 is inactivated by DPP-IV by N-terminal degradation of the peptide at position 2 alanine.
GLP-1 half-life in man is in the order of 1-2 min with a high clearance of 4-10 L/min.
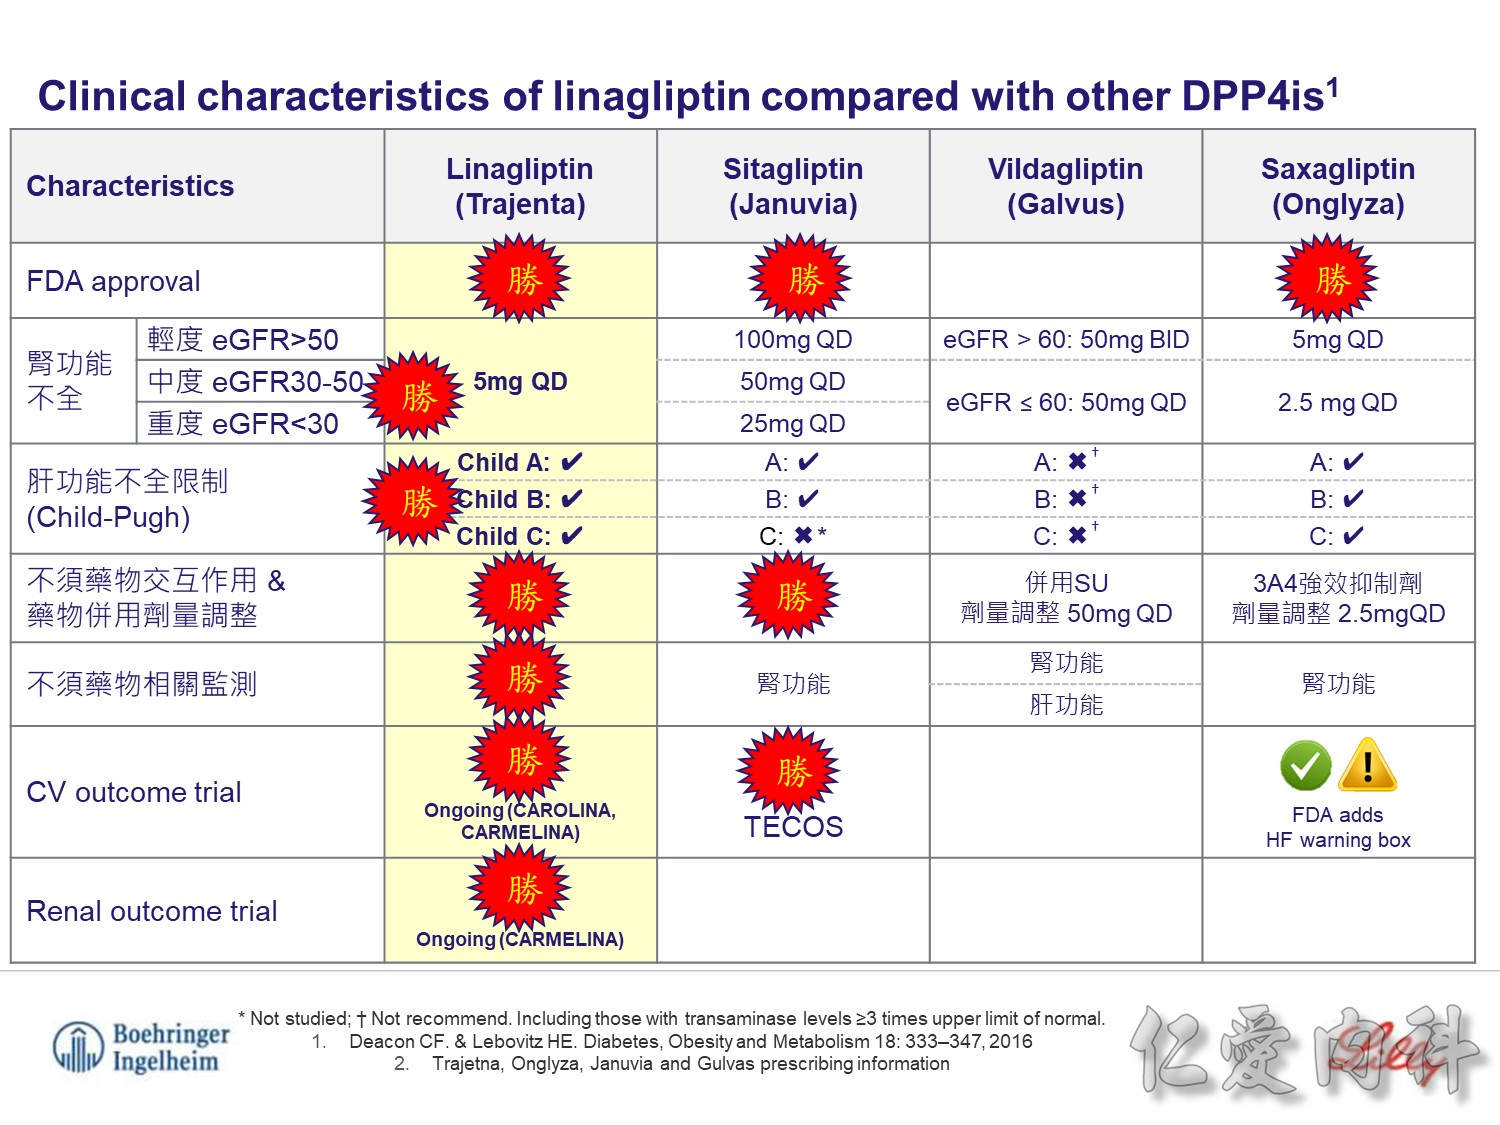
目前DPP4i比較中, Trajenta 不論肝腎功能, 療效一致
且不須額外的肝腎監測及劑量調整,不須擔心藥物交互作用
也是目前唯一有CV, renal outcomes trials的DPP4i
可提供最完整的療效及安全性資料
Mmol/L x 18 = mg/dl
Fanconi syndrome
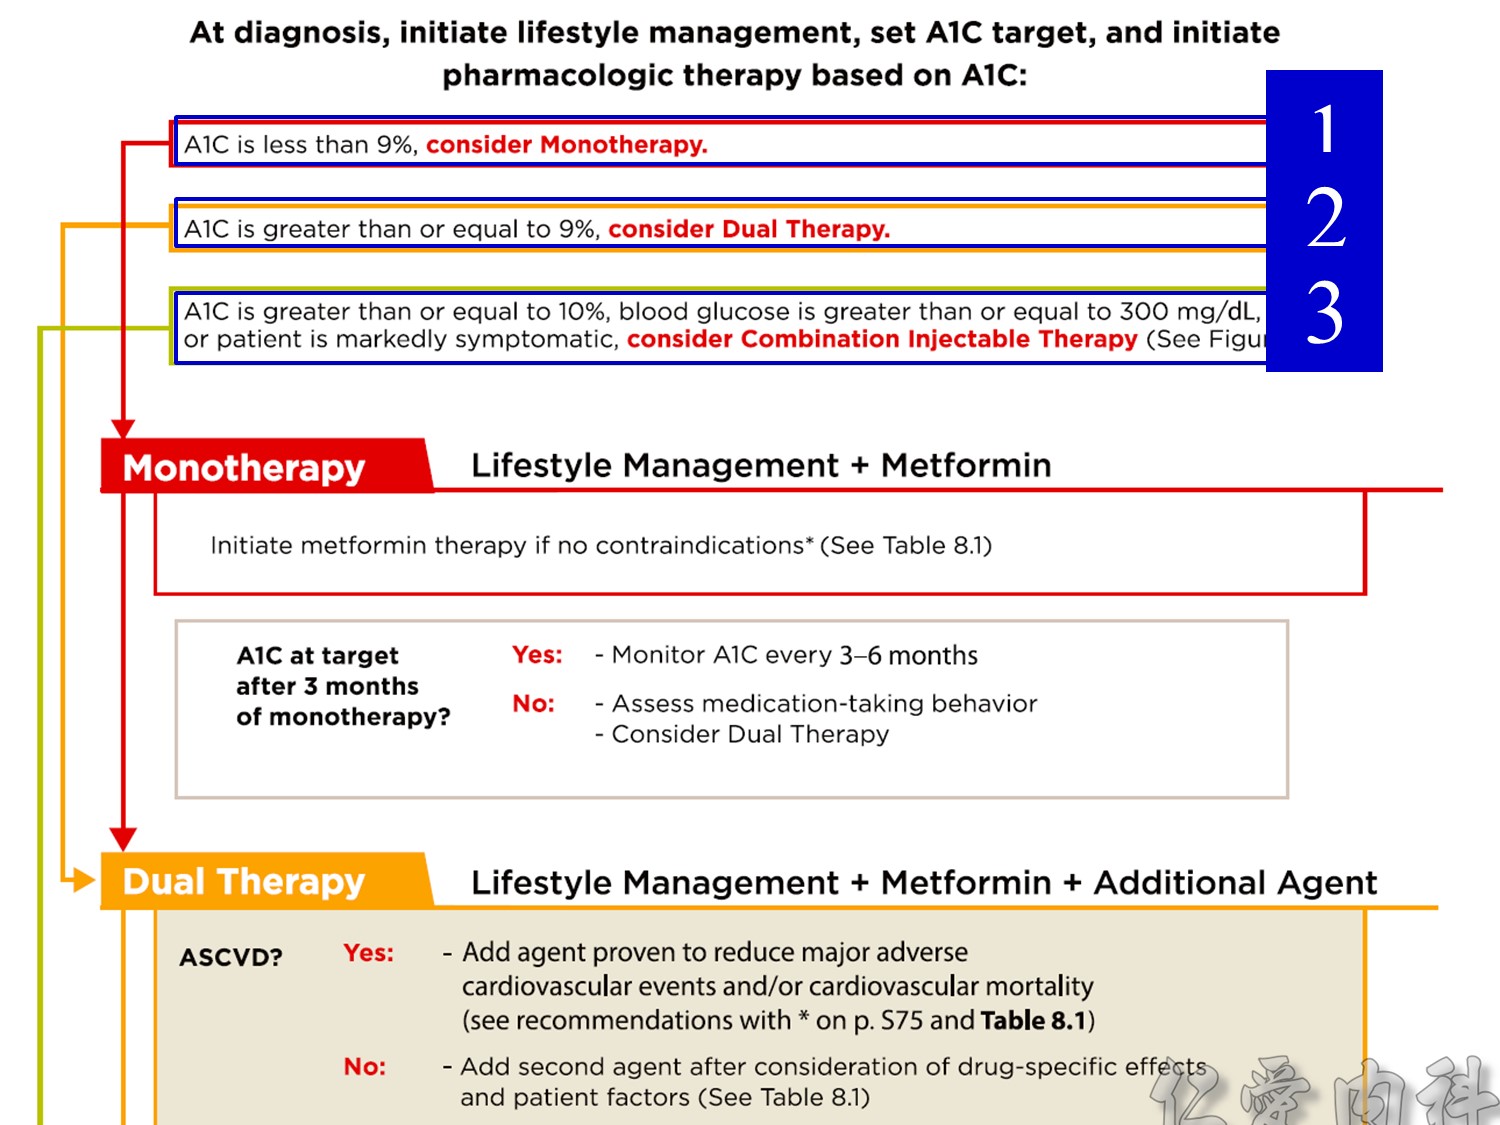
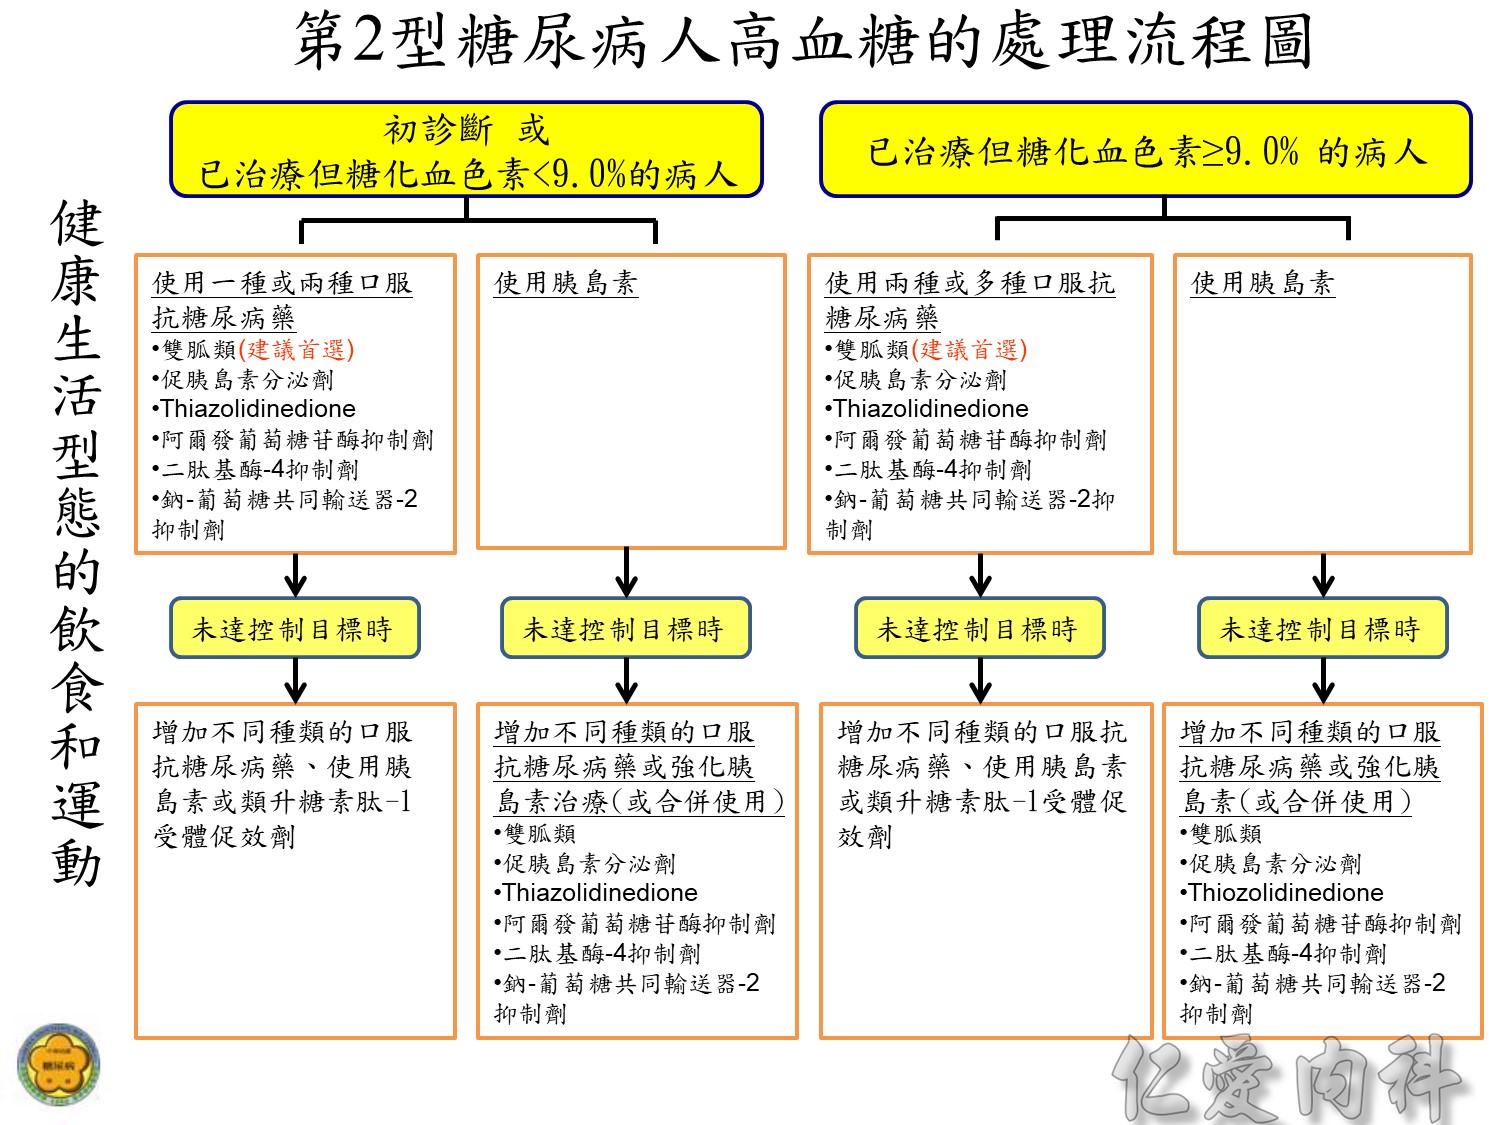
註1: 糖化血色素控制目標為<7%,但有些病人需要較寬鬆的目標。
註2: 選擇抗糖尿病藥,需依照病人個別情況而定,並避免發生低血糖. 口服抗糖尿病藥宜以雙胍類為優先。
註3: 使用強化胰島素治療時,通常不需同時使用促胰島素分泌劑。
註4: 同時使用胰島素和Thiazolidinedione,可能會增加水腫的機會並建議隨時注意病人心臟功能的變化。
註5: 適時調整抗糖尿病藥和胰島素,希望能使糖化血色素在3-12個月內達到治療目標,若未達到治療目標,宜轉診至專科醫師。
註6: 減重手術對第2型糖尿病併有病態性肥胖(身體質量指數≧35 kg/m2)的病人, 是一個適當的治療方式。